How much would it cost the federal government if AI unemployment became severe and permanent? A Homeland Controls fiscal model finds that a 10% unemployment rate could require $1.4–$2.2 trillion in additional annual federal support once households, not just the officially unemployed, are counted—and at 30% unemployment that figure could reach $5.7–$8.4 trillion a year, comparable to the entire federal budget.
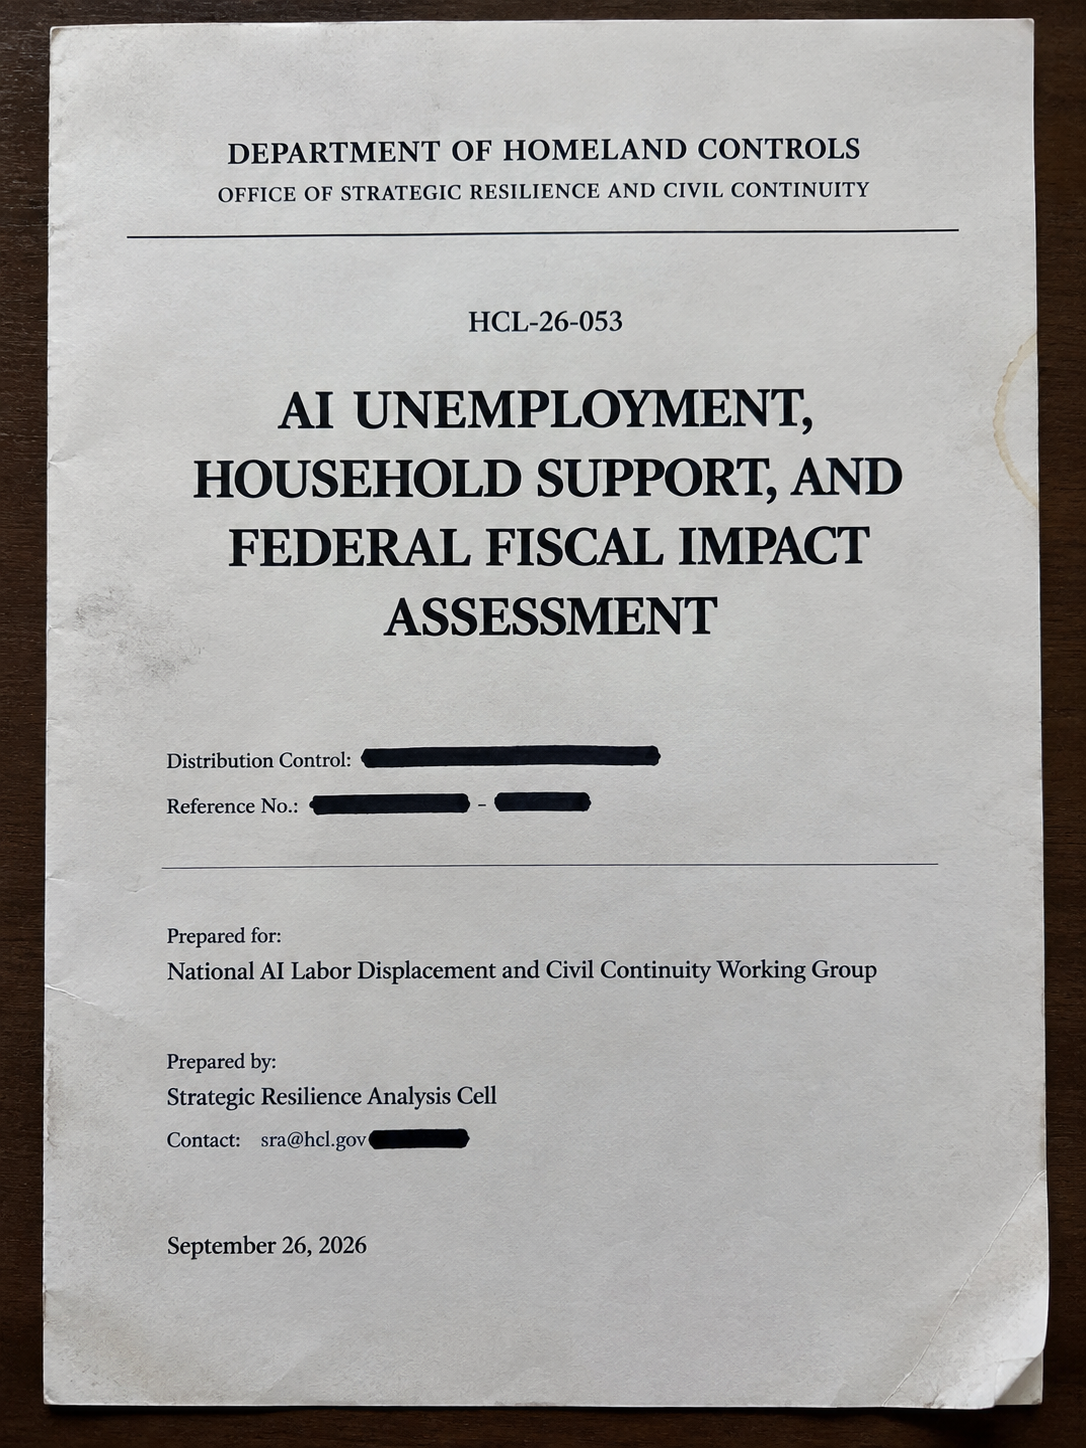
Department of Homeland Controls
Office of Strategic Resilience and Civil Continuity
Document: HCL-26-053
Prepared for: National AI Labor Displacement and Civil Continuity Working Group
Prepared by: Strategic Resilience Analysis Cell
Date: September 26, 2026
Status: Independent scenario-planning research and analysis prepared for Christians and Aliens. This document is not issued by, on behalf of, or under the authority of the United States Government or any existing government agency.
Classification: Public Release / Analytical Planning Assessment
Evidence cutoff: September 26, 2026
Executive Summary
Bottom-line judgment
If the United States had to provide full basic support to households whose primary or contributing earners became fully displaced by AI-related unemployment, and partial wage, benefit, and household-stability support to workers who remained employed but could no longer earn a livable income, the fiscal cost would rise rapidly from a manageable recession-response burden to a national economic-continuity burden measured in trillions of dollars per year.
The central finding is that a newspaper unemployment rate materially understates both the number of people affected and the potential federal fiscal exposure. A reported 10% unemployment rate corresponds to approximately 17 million officially unemployed workers when the labor force is assumed to be 170 million. In a prolonged AI-displacement event, however, the broader affected workforce could reach 30–50 million people when underemployment, discouraged workers, contract-income collapse, benefit loss, and blocked entry into stable work are included. Once spouses, children, dependent parents, disabled household members, and other people who rely on disrupted earners are counted, approximately 55–85 million people—or roughly 16–25% of the population—could experience material household instability.
Under the support assumptions used in this assessment, a 10% official unemployment rate could require approximately $1.4–$2.2 trillion in additional annual public support. That equals roughly 4–7% of current-dollar GDP, approximately 19–30% of the projected 2026 federal budget, and about 74–116% of the projected FY2026 federal deficit. It would be a major fiscal event even before accounting for lower tax receipts, higher debt-service costs, state and local revenue losses, and the economic damage associated with lost production.
At 15% unemployment, the modeled annual federal support requirement rises to approximately $2.3–$3.4 trillion, or about 7–10% of GDP. At 20%, it rises to approximately $3.2–$4.9 trillion, or about 10–15% of GDP. Under a prolonged 30% unemployment scenario, total annual support needs could reach approximately $5.7–$8.4 trillion, or roughly 18–26% of GDP—an amount comparable to, and potentially greater than, the entire baseline federal budget.
These are not forecasts. They are planning estimates intended to show the scale of a policy commitment to provide full basic support to fully dependent households and partial support to people who remain attached to work but cannot earn a livable wage. The estimates depend heavily on the duration of displacement, household composition, existing benefit eligibility, local cost of living, health-care costs, the degree of employment loss, the amount of wage replacement, and whether support is financed through borrowing, taxation, reprioritized spending, or monetary accommodation.
Required conclusion
The federal government must not wait for a headline unemployment rate to reach double digits before building the institutions required to prevent mass labor displacement from becoming permanent household dependency. A response that begins only after widespread unemployment appears in newspaper headlines will confront higher costs, greater inflation risk, larger debt burdens, weaker state and local governments, deeper household damage, and stronger pressure for coercive or rights-reducing policies.
The prudent course is to build early-warning systems, wage insurance, work sharing, portable benefits, entry-level career pathways, affordable housing capacity, food and health stabilizers, child-care and caregiving systems, local economic-diversification capacity, and lawful fiscal triggers before a severe AI-displacement scenario occurs.
These early-warning priorities are laid out in more detail in the AI Labor-Market Displacement: Provisional 180-Day Civil Continuity Risk Assessment.
1. Purpose and Scope
1.1 Purpose
This assessment expands the National AI Labor Displacement and Household Dependency analysis by modeling the potential annual federal cost of supporting the population affected under different newspaper-style unemployment rates.
It answers four questions:
- How many people could be fully dependent on public support when a worker becomes unemployed and their household income or benefits collapse?
- How many underemployed people could require partial wage, benefit, housing, food, health, child-care, or caregiving support because they remain employed but do not earn a livable wage?
- What annual federal expenditure would be required under a full-support and partial-support policy?
- How would such spending compare with GDP, the federal budget, the federal deficit, and the economy’s capacity to supply goods, services, labor, housing, energy, health care, and care work?
1.2 What this report does not assume
This report does not assume that all affected people would receive only federal aid, that all households have only one earner, or that every dependent household member would become a direct public-benefit recipient. It also does not assume that AI will produce any particular unemployment rate.
Instead, it models a policy choice: if a severe labor-market disruption occurred, and if the federal government attempted to prevent deprivation by supplying full basic support to fully displaced households and partial support to households with inadequate earned income, what would the fiscal burden look like?
1.3 Baseline fiscal context
For comparison, current-dollar GDP is approximately $32.5 trillion at an annual rate in the second quarter of 2026. The Congressional Budget Office projects FY2026 federal outlays of $7.4 trillion, revenues of $5.6 trillion, and a deficit of $1.9 trillion. Federal outlays are projected at 23.3% of GDP. These figures establish the scale against which the modeled support costs should be read.
These baseline figures are tracked on an ongoing basis in the AI Employment Status Report: National Early-Warning Dashboard.
2. Methodology and Assumptions
2.1 Population assumptions
The model uses the following rounded planning baselines:
| Variable | Planning assumption |
|---|---|
| Civilian labor force | 170 million people |
| Total U.S. population | 340 million people |
| Current-dollar GDP | $32.5 trillion annually |
| FY2026 federal outlays | $7.4 trillion |
| FY2026 federal revenues | $5.6 trillion |
| FY2026 baseline deficit | $1.9 trillion |
Official unemployment equals the stated unemployment rate multiplied by the assumed 170 million-person labor force. This is the number likely to be discussed in a newspaper headline.
2.2 Support categories
The fiscal model separates three groups.
Fully displaced workers and dependent household members are assumed to need a full basic economic-continuity package when the worker is unemployed and the household lacks sufficient earnings or assets. The package is designed to cover basic income replacement, food, housing stabilization, health coverage, utilities, transportation, child care or caregiving support where required, and administrative delivery.
Underemployed and inadequately paid workers are assumed to remain partially connected to work but need a partial package: wage insurance or income supplementation, health-coverage support, food or housing stabilization as needed, child-care or caregiving assistance, and retraining or transition services.
Dependent household members are not automatically treated as separate benefit recipients. Their needs are included where the household must receive additional support to maintain food, housing, health, care, and basic stability. The model uses household-level support costs to avoid double counting every spouse or child as an independent full-support case.
2.3 Annual cost assumptions
The model uses a range rather than a single benefit amount. Costs are stated in 2026 dollars and include program delivery, not only cash transfers.
| Support type | Low annual cost per person or household equivalent | Central annual cost | High annual cost per person or household equivalent | Included components |
|---|---|---|---|---|
| Full support for a fully displaced worker and dependent household members | $32,000 | $40,000 | $50,000 | Basic income replacement, food assistance, health coverage, housing and utility stabilization, child-care or caregiving support where needed, transportation, administrative delivery |
| Partial support for underemployed or inadequate-wage worker | $10,000 | $14,000 | $18,000 | Wage insurance or income supplement, benefit support, food or housing stabilization, training, child-care or caregiving support where needed, administrative delivery |
The full-support range is intentionally above the 2025 weighted poverty threshold of $32,970 for a family of four because a bare poverty threshold does not fully cover the cost of health care, housing instability, regional price variation, child care, transportation, utilities, benefit administration, and preserving household continuity. The model does not treat the poverty threshold as an adequate definition of a livable income.
2.4 Allocation of the broader affected workforce
At each unemployment rate, the model divides the broader economically unstable workforce into three categories:
- Officially unemployed workers who have no job and are actively seeking work.
- Underemployed and inadequate-wage workers whose hours, earnings, job quality, benefits, or contract income have fallen materially.
- Discouraged, labor-force-excluded, and blocked-entry workers who are not fully captured by the official unemployment measure.
The direct-support estimate includes a subset of the broader affected workforce. Some people will retain savings, another household income, severance, private insurance, family support, or an adequate part-time job. Other households will need full support even if the individual worker is technically employed because earnings have become inadequate.
2.5 Interpretation limits
The results should not be read as precise budget scores. Actual costs would differ based on program design, household size, regional prices, benefit coordination, duration, tax offsets, private savings, labor-market recovery, productivity gains, and the number of dependents per affected worker.
The purpose is to show orders of magnitude. It demonstrates why an AI-driven employment shock should be evaluated not only as a jobs problem but as a national fiscal, household, supply-capacity, inflation, and governance problem.
The originating mandate for this analysis is set out in Directive HCL-26-041: Six-Month Assessment of AI Labor-Market Displacement and Civil Continuity Risks.
3. Unemployment-Rate Impact Model
3.1 How a headline rate expands into a household crisis
A newspaper unemployment rate counts workers, not households. It also excludes many people whose economic position may deteriorate in an AI-displacement event: discouraged workers who stop actively looking for work; people with reduced hours; workers shifted from salaried work into unstable contract work; workers whose wages no longer cover basic expenses; independent workers who lose clients; and young adults unable to begin a career.
A 10% official unemployment rate means about 17 million officially unemployed workers under the 170 million-person labor-force assumption. That figure may coexist with 30–50 million directly affected workers and a total household-level population of 55–85 million people whose stability is threatened. The fiscal issue is not simply how much income to replace for 17 million people. It is how to stabilize tens of millions of households without exhausting the fiscal and real-resource capacity of the country.
3.2 Population and support model by unemployment rate
| Newspaper unemployment rate | Officially unemployed workers | Broader displaced or economically unstable workers | Workers likely to need direct support | Total affected including dependent household members | Share of total U.S. population affected |
|---|---|---|---|---|---|
| 4% | 6.8 million | 10–18 million | 4–9 million | 12–25 million | 4–7% |
| 6% | 10.2 million | 18–30 million | 8–16 million | 25–45 million | 7–13% |
| 8% | 13.6 million | 25–40 million | 12–23 million | 40–65 million | 12–19% |
| 10% | 17.0 million | 30–50 million | 18–30 million | 55–85 million | 16–25% |
| 15% | 25.5 million | 45–70 million | 30–45 million | 85–125 million | 25–37% |
| 20% | 34.0 million | 60–95 million | 40–65 million | 115–175 million | 34–51% |
| 25% | 42.5 million | 75–115 million | 55–80 million | 150–215 million | 44–63% |
| 30% | 51.0 million | 90–135 million | 70–100 million | 190–260 million | 56–76% |
3.3 Fiscal model by unemployment rate
The following table models annual additional federal spending under a support policy that supplies full basic support to the fully displaced household population and partial support to underemployed or inadequate-wage workers. The low and high ranges reflect uncertainty in household composition, benefit design, local costs, health coverage, housing needs, wage replacement, and duration.
| Newspaper unemployment rate | Estimated fully supported household-equivalent population | Estimated partially supported underemployed or inadequate-wage workers | Additional annual federal support cost | Cost as share of GDP | Cost as share of FY2026 federal outlays | Cost relative to FY2026 baseline deficit |
|---|---|---|---|---|---|---|
| 4% | 5–9 million | 5–9 million | $0.3–$0.6 trillion | 1–2% | 4–8% | 16–32% |
| 6% | 9–15 million | 9–15 million | $0.6–$1.1 trillion | 2–3% | 8–15% | 32–58% |
| 8% | 13–21 million | 12–19 million | $0.9–$1.6 trillion | 3–5% | 12–22% | 47–84% |
| 10% | 18–30 million | 12–20 million | $1.4–$2.2 trillion | 4–7% | 19–30% | 74–116% |
| 15% | 30–45 million | 15–25 million | $2.3–$3.4 trillion | 7–10% | 31–46% | 121–179% |
| 20% | 40–65 million | 20–30 million | $3.2–$4.9 trillion | 10–15% | 43–66% | 168–258% |
| 25% | 55–80 million | 20–35 million | $4.3–$6.5 trillion | 13–20% | 58–88% | 226–342% |
| 30% | 70–100 million | 20–35 million | $5.7–$8.4 trillion | 18–26% | 77–114% | 300–442% |
The central 10% scenario is illustrative. It assumes that 18–30 million household-equivalent cases receive full support at roughly $32,000–$50,000 per year and that 12–20 million workers receive partial support at roughly $10,000–$18,000 per year. The result is an additional annual cost of roughly $1.4–$2.2 trillion before considering the loss of tax revenue caused by lower wages, lower profits, weaker consumption, and reduced business activity.
3.4 Total fiscal gap, including lower revenue
The additional support cost is not the full fiscal effect. Higher unemployment and underemployment would likely reduce individual income-tax receipts, payroll-tax receipts, corporate-tax receipts, capital-gains realizations, state and local sales taxes, and business activity. A severe shock can also raise ordinary safety-net spending before any new program is adopted.
For planning purposes, the Working Group estimates the following additional annual revenue-loss range beyond direct support costs:
| Newspaper unemployment rate | Illustrative annual federal revenue loss and automatic-stabilizer pressure | Combined fiscal deterioration: new support cost plus revenue loss |
|---|---|---|
| 4% | $0.1–$0.2 trillion | $0.4–$0.8 trillion |
| 6% | $0.2–$0.4 trillion | $0.8–$1.5 trillion |
| 8% | $0.3–$0.6 trillion | $1.2–$2.2 trillion |
| 10% | $0.5–$0.9 trillion | $1.9–$3.1 trillion |
| 15% | $0.8–$1.4 trillion | $3.1–$4.8 trillion |
| 20% | $1.1–$2.0 trillion | $4.3–$6.9 trillion |
| 25% | $1.5–$2.5 trillion | $5.8–$9.0 trillion |
| 30% | $2.0–$3.5 trillion | $7.7–$11.9 trillion |
These combined figures are not a claim that the entire sum would be financed by new borrowing. The mix would depend on Congress and the Administration: tax changes, reprioritized spending, temporary borrowing, transfers from states, use of existing programs, emergency monetary operations, and private-sector or nonprofit participation. The table illustrates the size of the fiscal deterioration that policymakers would have to finance or offset.
Current indicators relevant to this revenue-loss modeling are tracked in the AI Employment Status Report: National Early-Warning Dashboard.
4. GDP, Deficits, Debt, and Budget Capacity
4.1 Comparing support costs with GDP
GDP measures the value of final goods and services produced in the economy. It is not a cash reserve available to government. A support program equal to 7% of GDP does not mean the government can simply take 7% of GDP without consequences. It means the public sector would be attempting to redirect, borrow against, or create claims on an amount of purchasing power equal to 7% of annual economic output.
At the modeled 10% unemployment rate, annual direct support of $1.4–$2.2 trillion represents approximately 4–7% of GDP. When revenue losses are added, total fiscal deterioration of $1.9–$3.1 trillion represents approximately 6–10% of GDP. This would occur on top of the CBO baseline deficit of $1.9 trillion.
At 20% unemployment, combined fiscal deterioration of $4.3–$6.9 trillion would represent approximately 13–21% of GDP. At 30%, the modeled combined deterioration of $7.7–$11.9 trillion would represent approximately 24–37% of GDP. At that level, the country could not treat the problem as an ordinary countercyclical spending package. It would be a redesign of the relationship between production, income, taxation, public finance, work, and household support.
4.2 Comparison with the baseline federal budget
The CBO baseline projects $7.4 trillion in FY2026 federal outlays. At a 10% unemployment rate, direct additional support alone could add 19–30% to the baseline federal budget. Including revenue losses, fiscal deterioration could equal 26–42% of baseline outlays.
At 20% unemployment, direct support could equal 43–66% of baseline outlays. At 30%, direct support alone could approach or exceed the entire baseline federal budget. This means that current agencies, benefit-delivery systems, financial controls, staffing structures, data systems, and local partners are not scaled for a permanent high-unemployment environment.
4.3 Debt and interest pressure
If the additional spending is financed primarily through borrowing, federal debt rises while interest costs compound. A higher debt load can increase the amount of government revenue committed to servicing prior borrowing, leaving less fiscal room for infrastructure, defense, research, health care, disaster response, and ordinary public services.
The effect depends on interest rates, growth, inflation, investor demand for Treasury securities, the maturity structure of debt, and the credibility of the fiscal response. In a severe recession, interest rates may fall temporarily and private demand may weaken, making deficit spending less inflationary in the short run. But a prolonged support requirement lasting years would increase the danger that interest costs crowd out other public priorities or force future tax increases, spending cuts, financial repression, or monetary accommodation.
4.4 State and local fiscal stress
Even if the federal government funds much of the safety net, state and local governments would face rising demand and falling revenue. Many state and local systems have balanced-budget requirements or limited borrowing capacity. Sales-tax receipts, income-tax receipts, property-tax collections, transit revenue, utility revenue, community-college capacity, public-health services, behavioral-health care, shelters, courts, and public safety can all face pressure at the same time.
A federal support program that ignores state and local delivery capacity may fail even if Congress appropriates sufficient money. The program must include administrative grants, technology modernization, fraud prevention, staffing, appeals, local-provider capacity, and contingency funding for schools, hospitals, housing systems, and public services.
The near-term risk assumptions behind this modeling are detailed in the AI Labor-Market Displacement: Provisional 180-Day Civil Continuity Risk Assessment.
5. Inflation and Real-Resource Effects
5.1 General inflation judgment
Large support spending is not automatically inflationary by a fixed amount. Inflation depends on whether new demand exceeds the economy’s ability to supply goods and services, whether idle workers and facilities can be brought back into productive use, how the program is financed, whether imports can meet demand, and whether critical sectors such as housing, health care, energy, child care, transportation, food, and skilled labor are already supply constrained.
In the early stage of a severe unemployment shock, support may be partly disinflationary or inflation-neutral relative to doing nothing because it replaces lost private income and prevents a collapse in demand. If millions of people are unemployed and businesses have unused capacity, public support can sustain consumption without necessarily bidding up prices broadly.
The inflation risk rises when large transfers persist while productive capacity, housing supply, energy supply, health-care capacity, child-care capacity, skilled labor, and critical inputs fail to expand. Under those conditions, public spending creates purchasing power faster than the economy can produce the real goods and services households need. The result is likely to be concentrated inflation in constrained essentials first, followed by broader price pressures if deficits are monetized or if inflation expectations become unanchored.
5.2 Why full support can create scarcity pressure
A national support program delivers money or purchasing power. It does not automatically create apartments, doctors, nurses, child-care slots, elder-care workers, electricity, food-processing capacity, construction crews, transportation systems, or skilled maintenance workers.
If the country tries to support 55–85 million affected people at a 10% unemployment rate, demand for rent assistance, medical care, behavioral-health care, food, utilities, transportation, education, child care, and caregiving services could increase rapidly. If the supply of those services is constrained, the first effect may be price increases, waiting lists, reduced quality, geographic shortages, and political conflict over allocation.
The same condition is more severe at 15%, 20%, and 30% unemployment. At those levels, a support system can become a competition for a limited supply of basic necessities. The economy would be forced to choose among higher prices, rationing, import dependence, targeted subsidies, supply expansion, tax increases, borrowing, reduced support levels, or some combination of these measures.
5.3 Distributional inflation
The most likely inflation pressure would not be evenly distributed. It would be concentrated in sectors where supply cannot respond quickly:
- Rental housing, shelter, utilities, and home repair.
- Health care, behavioral health, prescription drugs, and long-term care.
- Child care, elder care, disability services, and home health.
- Food distribution and local food access in underserved areas.
- Energy, transportation, and vehicle repair.
- Skilled trades, construction, grid work, and infrastructure maintenance.
- Education, training, broadband, devices, and credentialing.
This matters because low-income and displaced households spend a greater share of income on necessities. Even if headline inflation appears moderate, concentrated price increases in rent, food, health care, energy, and care work can make a support package inadequate in practice.
5.4 Financing choices and inflation risk
| Financing approach | Short-run effect | Longer-run risk |
|---|---|---|
| Borrowing during a deep slump | Can sustain demand and prevent deflationary collapse | Debt and interest costs rise; inflation risk grows if support persists after capacity is constrained |
| Higher taxes on income, wealth, profits, or consumption | Reduces private demand while funding support | Can reduce inflation pressure but may weaken investment, labor supply, or political legitimacy depending on design |
| Reprioritizing existing federal spending | Limits deficit growth | Reduces other public functions and may shift the burden to defense, infrastructure, research, health, or local programs |
| Monetary accommodation | Can prevent financial collapse and stabilize credit | Risks broader inflation, currency pressure, asset-price distortion, and loss of confidence if used to finance persistent deficits |
| Supply-side investment paired with support | Expands housing, energy, health, care, infrastructure, and productive capacity | Requires time, skilled labor, materials, and competent execution; may not relieve short-term shortages immediately |
5.5 Core finding on inflation
The least inflationary response to mass AI displacement is not simply to spend less. It is to prevent displacement from becoming permanent in the first place and to pair income support with rapid expansion of productive capacity. Wage insurance, work sharing, training linked to real jobs, housing construction, energy and grid investment, care-work expansion, local infrastructure, and preservation of entry-level labor pathways can reduce both human hardship and inflation pressure.
A policy that sends purchasing power to households while allowing housing, health care, energy, food distribution, child care, elder care, and skilled-labor capacity to stagnate will produce more inflation than a policy that supports households and expands supply at the same time.
For a closer look at which occupations face this kind of transformation rather than outright elimination, see Jobs AI Is Likely to Change—Not Simply Replace.
6. How Mass Support Drains the Economy
6.1 Fiscal-resource drain
A sustained emergency support program consumes fiscal capacity. Money devoted to income replacement and household stabilization cannot simultaneously be used for every other public priority. Even if borrowing funds the program initially, future taxes or reduced spending elsewhere may be required to service the debt.
The relevant question is not whether support spending is morally justified. In a severe crisis, it may be essential. The question is whether the country has prepared enough productive capacity, delivery capacity, and fiscal space to provide support without abandoning other necessary functions.
6.2 Labor and skill drain
If AI displaces workers faster than the economy creates roles that use their skills, the country can lose human capital. Workers’ skills atrophy, professional networks weaken, apprenticeships disappear, and younger adults fail to accumulate experience. At the same time, essential sectors may suffer shortages because displaced workers cannot easily move into care work, construction, maintenance, health services, education, energy, or infrastructure without paid pathways and support.
A society can therefore experience an apparent surplus of labor alongside shortages of essential workers. The mismatch itself becomes a drain: work remains undone while people remain underutilized.
6.3 Administrative and delivery drain
Emergency support at national scale requires eligibility systems, identity verification, appeals, fraud prevention, call centers, caseworkers, payment platforms, auditors, local service providers, health navigators, housing counselors, child-care administrators, and data-security capacity. These systems compete for skilled personnel with private industry, state governments, hospitals, banks, insurers, schools, and technology firms.
Without modernized systems, a large support program risks delay, error, fraud, exclusion of legitimate claimants, and public distrust. The burden is not merely the value of benefits paid. It is the operating capacity required to deliver benefits fairly and accurately.
6.4 Investment and innovation drain
High and persistent deficits can compete with private investment for savings and can increase uncertainty about future taxes, interest rates, regulation, and consumer demand. These effects are not automatic, and they may be muted during a downturn with weak private investment. But over time, a country spending a growing share of output on income maintenance rather than productive investment risks slower growth.
The danger is especially sharp if the same AI systems that displace workers concentrate productivity gains in a small number of firms while public systems absorb the support costs. In that case, private returns remain concentrated while the public finances household stability. The economy becomes fiscally fragile and politically unstable.
6.5 Social-capital drain
Long-term dependency caused by lack of opportunity can erode trust, family stability, local institutions, volunteer capacity, and confidence that work provides a path to dignity and advancement. This is not an argument to withdraw support. It is an argument to design support around continuity, participation, and restoration of meaningful opportunity.
Programs should preserve household stability while helping people gain access to work, ownership, caregiving, education, entrepreneurship, community service, and other forms of dignified participation. A system that only administers income without restoring pathways can become expensive, politically brittle, and socially corrosive.
The broader governance risks of unmanaged dependency are examined in Brace Yourselves for the Governmental Control Super Storm.
7. Recommended Fiscal and Economic Strategy
7.1 Build the lower-cost response first
The lowest-cost strategy is early intervention that prevents workers and households from reaching full dependency. The Working Group recommends:
- National early-warning indicators focused on hiring, entry-level pathways, hours, earnings, benefit loss, household delinquency, and regional service stress.
- Work-sharing programs that preserve employment and benefits while reducing hours.
- Wage insurance for workers whose new job pays materially less than the role they lost.
- Portable benefits that remain with workers across jobs, contracts, and transitions.
- Paid apprenticeships and junior-role preservation measures to prevent entry-ladder collapse.
- Rapid retraining only where linked to verified employer demand and paid work pathways.
- Housing, food, health, child-care, and caregiving stabilization before household assets are exhausted.
- Local economic-diversification grants in regions with concentrated AI exposure.
7.2 Use graduated support rather than a single permanent benefit
Support should be graduated to the depth and duration of need:
| Condition | Preferred response |
|---|---|
| Temporary hours reduction | Short-time compensation and partial wage replacement |
| Permanent pay reduction after reemployment | Time-limited wage insurance and portable-benefit support |
| Loss of employer benefits | Immediate health-coverage and benefit-continuity assistance |
| Full job loss with active search | Unemployment insurance, reemployment services, and household stabilization |
| Long-duration displacement | Higher-intensity income, housing, health, care, retraining, and placement support |
| Regional employment collapse | Federal-state-local continuity activation, local fiscal aid, public-purpose work, and supply-capacity investment |
7.3 Pair transfers with supply expansion
To limit inflation and relieve scarcity, every major household-support measure should be paired with investment that expands the supply of necessities and productive capacity:
- Housing construction, rehabilitation, utility modernization, and zoning or permitting reform where lawful.
- Grid, energy, water, transportation, and broadband investment.
- Health-care workforce expansion, behavioral-health capacity, and medication access.
- Child-care, elder-care, disability-service, and home-health workforce development.
- Paid pathways into construction, maintenance, infrastructure, energy, manufacturing, and care work.
- Local food distribution, repair capacity, small-business finance, and regional manufacturing resilience.
7.4 Protect fiscal credibility
Emergency spending should be transparent, time-limited where possible, independently audited, and tied to published triggers. The public must be able to see what is being spent, who is eligible, what outcomes are improving, what fraud controls exist, and when programs escalate or wind down.
Support should not be financed through hidden off-budget structures, permanent emergency declarations, surveillance systems, forced labor, arbitrary rationing, or political favoritism. Those approaches would undermine trust and intensify the risk of a broader governance crisis.
7.5 Preserve rights and dignity
No fiscal response may treat unemployed, underemployed, dependent, disabled, caregiving, retired, or displaced people as a population to be controlled. The federal objective must be continuity, opportunity, and equal dignity.
The warning described in The Government’s Plan to Contain the Alien Contagion remains relevant as a fictional caution: when authorities treat human beings as disposable because they are no longer economically useful, a fiscal emergency can become a pretext for classification, coercion, and abuse. The correct response is to design systems that preserve rights while preventing technological progress from producing permanent exclusion.
The historical precedents behind this caution are outlined in The Historical Case for Alien Encounter Scenarios: U.S. Government Precedents Behind Each Category.
8. Conclusion
The fiscal consequences of permanent, large-scale AI displacement could exceed the capacity of today’s labor-market, benefit-delivery, and budget systems. A 10% unemployment rate, which a newspaper reader might interpret as 17 million people without jobs, could in fact correspond to 55–85 million Americans whose household stability is endangered once underemployment, discouraged workers, inadequate wages, benefit loss, and dependent family members are counted.
Providing full basic support to fully displaced households and partial support to workers who cannot earn a livable wage could require an additional $1.4–$2.2 trillion per year at that 10% unemployment rate, before revenue losses. Including likely revenue loss and automatic-stabilizer pressure, the total fiscal deterioration could reach $1.9–$3.1 trillion per year, equal to roughly 6–10% of GDP and comparable to or greater than the projected FY2026 federal deficit.
At 20% unemployment, the combined annual fiscal deterioration could reach $4.3–$6.9 trillion. At 30%, it could reach $7.7–$11.9 trillion. These ranges show that a crisis of massive permanent unemployment would not be a normal unemployment-insurance problem. It would be an economic-continuity emergency requiring a national rethinking of income, benefits, work, household support, productivity distribution, fiscal capacity, and supply expansion.
The federal government must begin building the lower-cost preventive infrastructure now. Early warning, work sharing, wage insurance, portable benefits, paid entry pathways, local investment, housing and care capacity, and transparent fiscal triggers are less costly and less inflationary than attempting to support tens of millions of fully dependent households after the labor market has already failed.
The national objective must be clear: preserve human dignity and meaningful participation while ensuring that the productivity gains from AI strengthen the country’s productive capacity rather than create a permanently dependent population whose basic needs overwhelm public finance.
The near-term civil-continuity risks underlying this assessment are detailed in the AI Labor-Market Displacement: Provisional 180-Day Civil Continuity Risk Assessment.
Appendix A: Calculation Notes
The direct-support cost range is calculated as:
+
Partially supported workers × annual partial-support cost
The model uses a full-support package of $32,000–$50,000 per household-equivalent case and a partial-support package of $10,000–$18,000 per underemployed or inadequate-wage worker. Costs are in 2026 dollars and include program delivery.
The model intentionally does not apply a separate full-support payment to every dependent household member. Doing so would double count costs already included in household-level housing, food, health, utility, care, and income support. Dependents expand the number of people affected and the complexity of services required; they do not necessarily multiply the cash cost one-for-one.
The figures are annualized estimates. A shorter crisis may cost less in one year but still cause permanent damage if households lose housing, health coverage, skills, savings, or family stability. A multi-year crisis may cost more as temporary programs become ongoing, health and care needs rise, local governments weaken, debt service compounds, and inflation erodes nominal benefit adequacy.
Appendix B: Key Definitions
Official unemployment rate: The percentage of the civilian labor force that is without a job, available for work, and actively seeking work under the standard labor-force survey definition.
Broader displaced or economically unstable workers: Workers experiencing official unemployment, inadequate hours, inadequate earnings, involuntary temporary or contingent work, loss of employment-linked benefits, labor-force withdrawal after unsuccessful job search, contract-income collapse, or blocked entry into stable work due in part to AI-related economic change.
Fully supported household-equivalent population: The estimated number of worker-and-dependent household cases requiring a full basic package of income, food, housing, health, utility, transportation, care, and administrative support because earned income and available resources are insufficient.
Partially supported underemployed or inadequate-wage worker: A worker who remains attached to work but needs wage insurance, income supplementation, benefit support, food or housing stabilization, care support, training, or transition assistance because earnings are insufficient for basic household continuity.
Total affected population: Directly affected workers plus the spouses, children, dependent parents, disabled household members, and other people whose economic security or household stability relies on a disrupted worker’s income or benefits.
Livable wage: Earnings sufficient to maintain basic household stability, including food, housing, utilities, health coverage, transportation, child care or caregiving where required, and reasonable participation in community life. It is not synonymous with the federal poverty threshold.
Civil continuity: The ability of households, communities, institutions, and critical systems to maintain basic economic security, essential services, social cohesion, caregiving capacity, and lawful democratic functioning during sustained disruption.