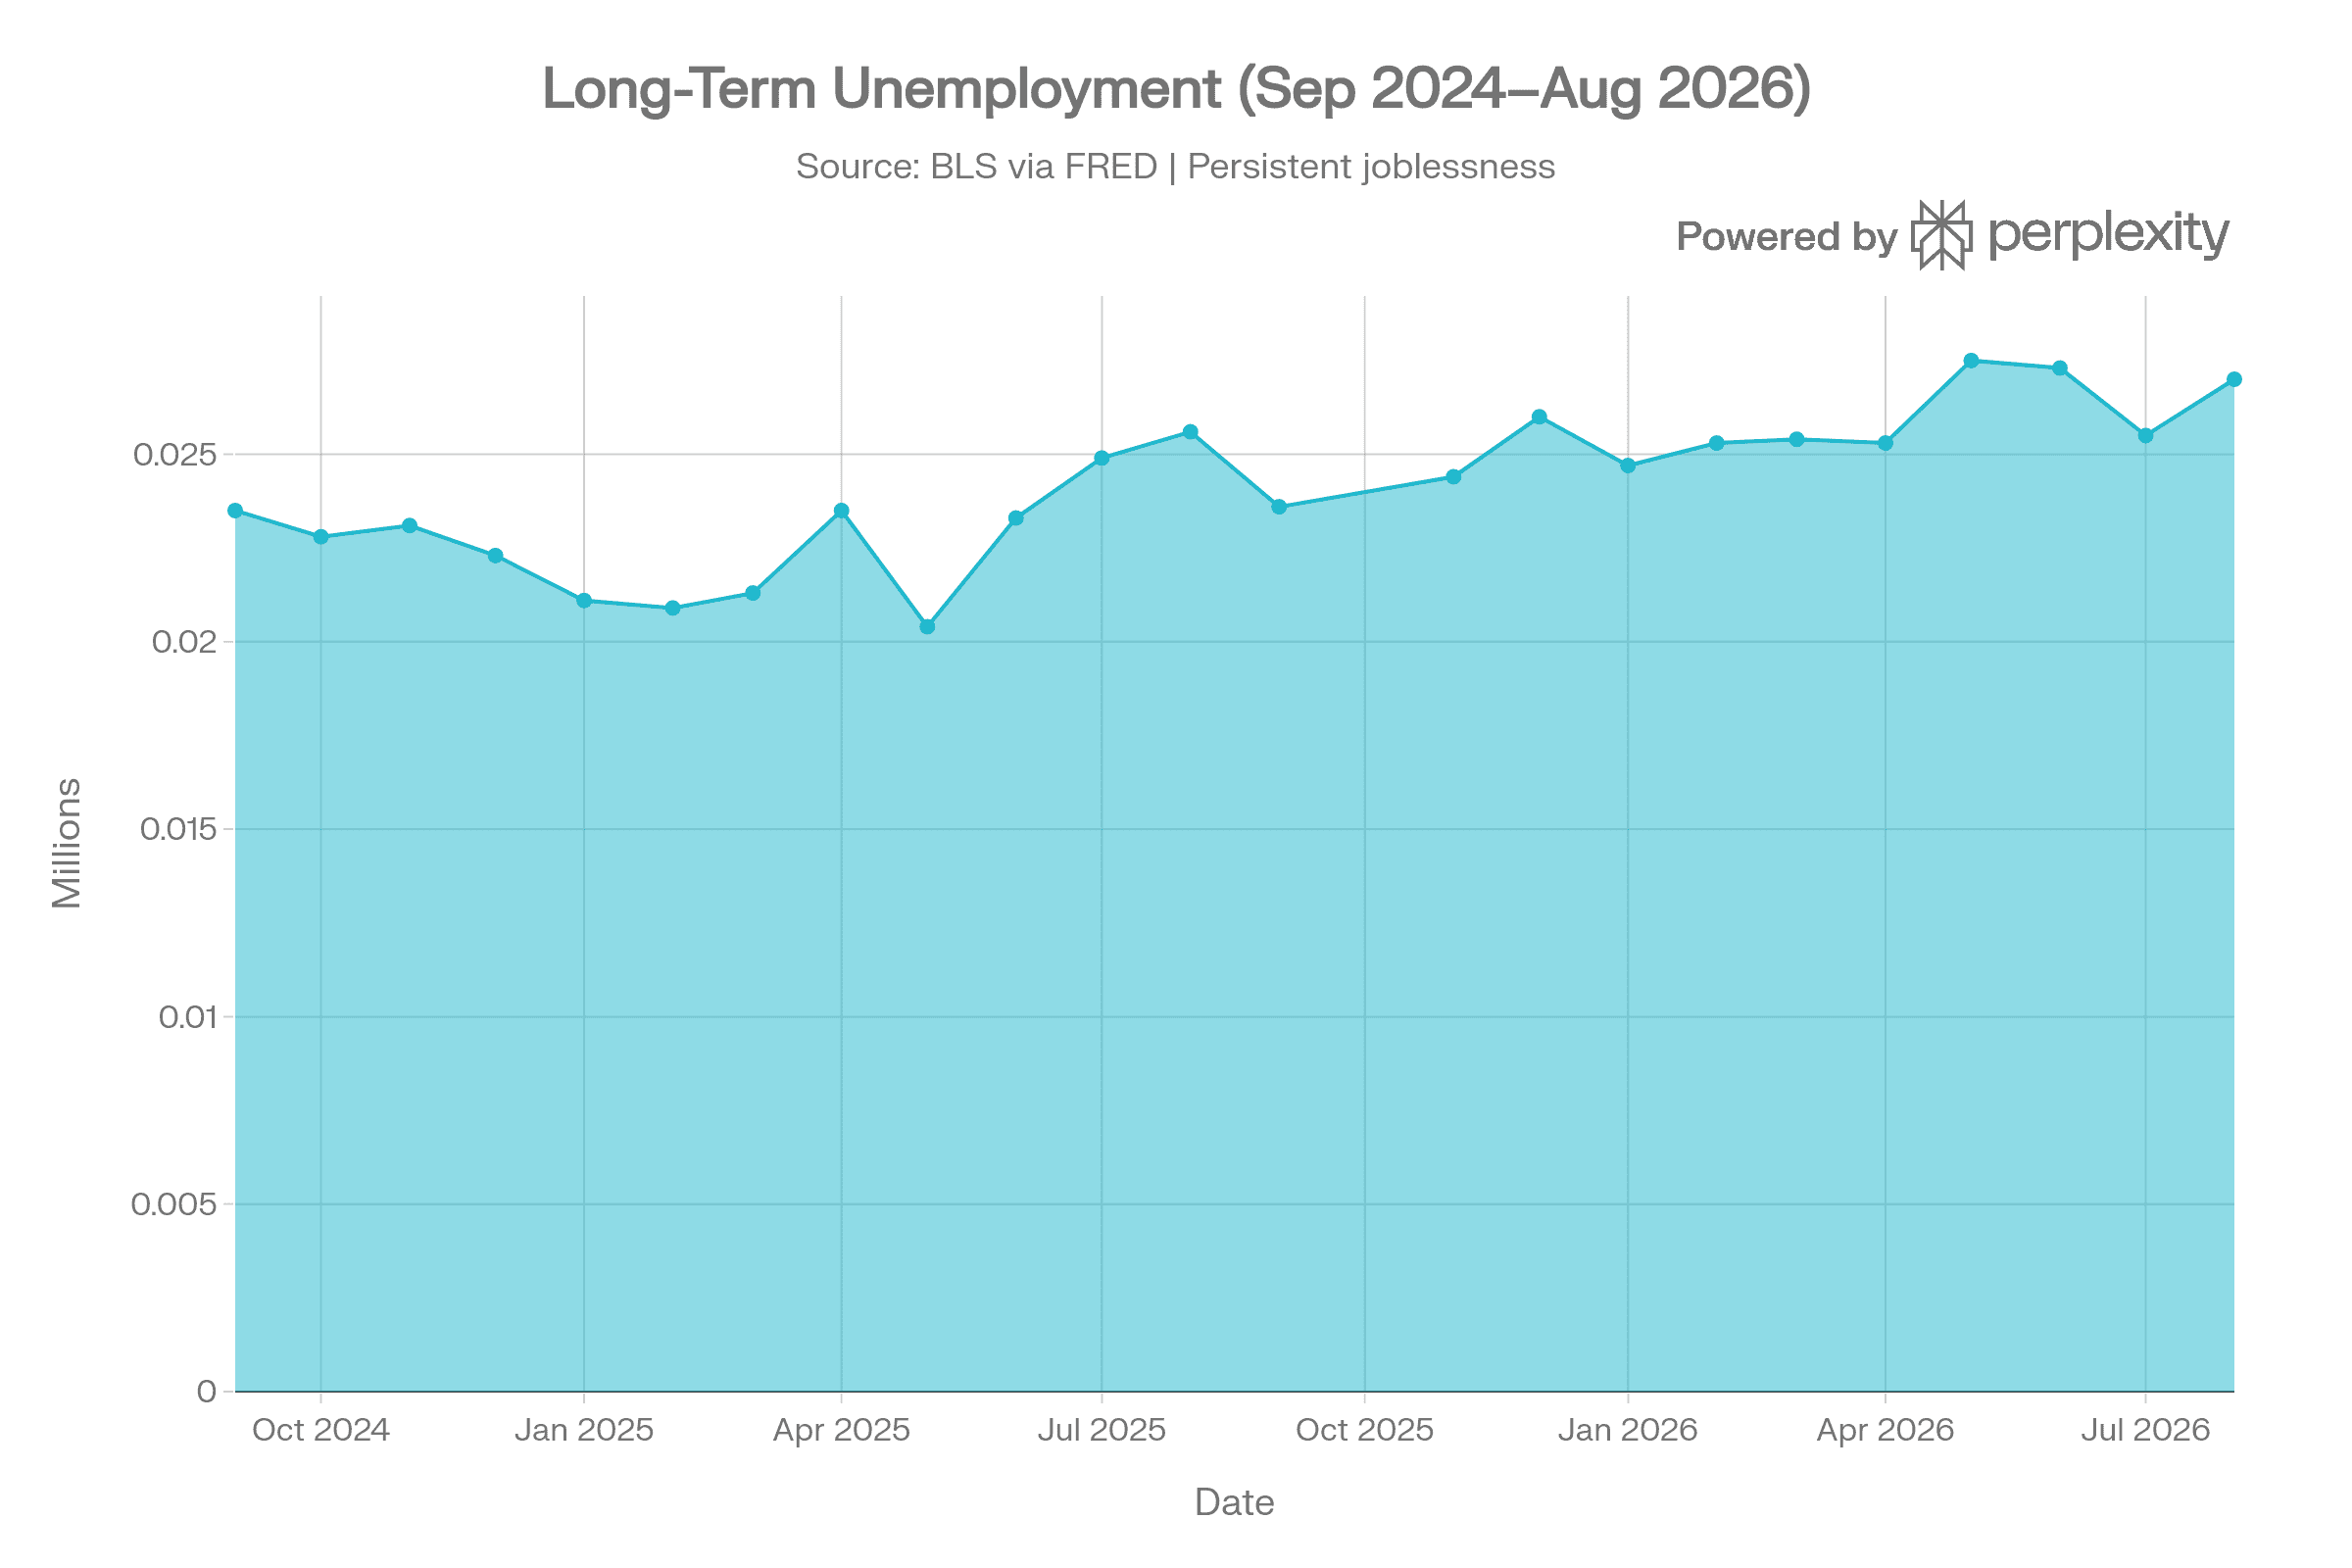
Is AI already causing mass unemployment in the United States? The government’s own early-warning dashboard says no, not yet—broad unemployment and underemployment have stayed roughly flat—but long-term joblessness has jumped nearly 20% and actual hiring is falling even as job openings rise, which is why officials rate the national picture “Yellow: Monitor Closely” rather than declaring an emergency.
Department of Homeland Controls
Office of Strategic Resilience and Civil Continuity
AI Employment Status Report — National Early-Warning Dashboard
Reporting date: September 12, 2026
Coverage: United States national indicators, generally September 2024 through September 2026
Status: Scenario-planning document; not an actual United States government report or statement of an existing agency.
Executive Status
The national AI employment picture is mixed and elevated for monitoring, but not sufficient to establish that artificial intelligence has caused nationwide mass unemployment. Several broad indicators remain stable or favorable: the U-6 underemployment rate was 7.7% in August 2026, unchanged from September 2024; continued unemployment claims and involuntary part-time employment both declined over the period; job openings rose; and state-local tax receipts increased.
The early-warning concern lies in the indicators that describe the quality, duration, and distribution of labor-market stress rather than only the total number of jobs. Actual monthly hires fell from approximately 5.43 million to 5.05 million. The number of people unemployed for 27 weeks or longer rose from about 1.61 million to 1.93 million. Prime-age labor-force participation edged down, mortgage delinquency rose, and monthly 988 crisis-line contacts increased from roughly 518,000 to 708,000.
The principal risk remains a quiet employment transition: fewer entry-level jobs, reduced career ladders, delayed hiring, lower-quality work, and longer spells without stable employment. Those conditions can damage household security and community capacity before the official unemployment rate signals a national emergency.
Status Assessment
| Status level | Assessment | Meaning |
|---|---|---|
| National employment | Yellow / Monitor closely | National labor indicators do not show a confirmed AI-driven employment emergency, but several leading and persistence indicators warrant elevated attention. |
| Early-career pathways | Yellow / Investigate | Young-worker unemployment remains high relative to workers ages 25–34; more detailed occupation-specific hiring data are needed. |
| Persistent joblessness | Amber / Rising concern | Long-term unemployment increased approximately 20% across the available period. |
| Household financial stress | Yellow / Uneven | Mortgage delinquency rose, while credit-card delinquency fell; food-assistance enrollment must be interpreted carefully because policy and eligibility changes affect it. |
| Mental-health demand | Amber / Rising demand | 988 contacts grew substantially, but the change cannot be attributed solely to labor-market conditions. |
| Local fiscal capacity | Green nationally / Unknown locally | National state-local tax receipts rose; this can mask hardship in individual regions. |
| Critical-workforce capacity | Yellow / Labor bottleneck | Construction job openings increased, indicating potential skilled-trade constraints alongside other labor-market slack. |
Labor-Market Indicators
Young-Worker Unemployment
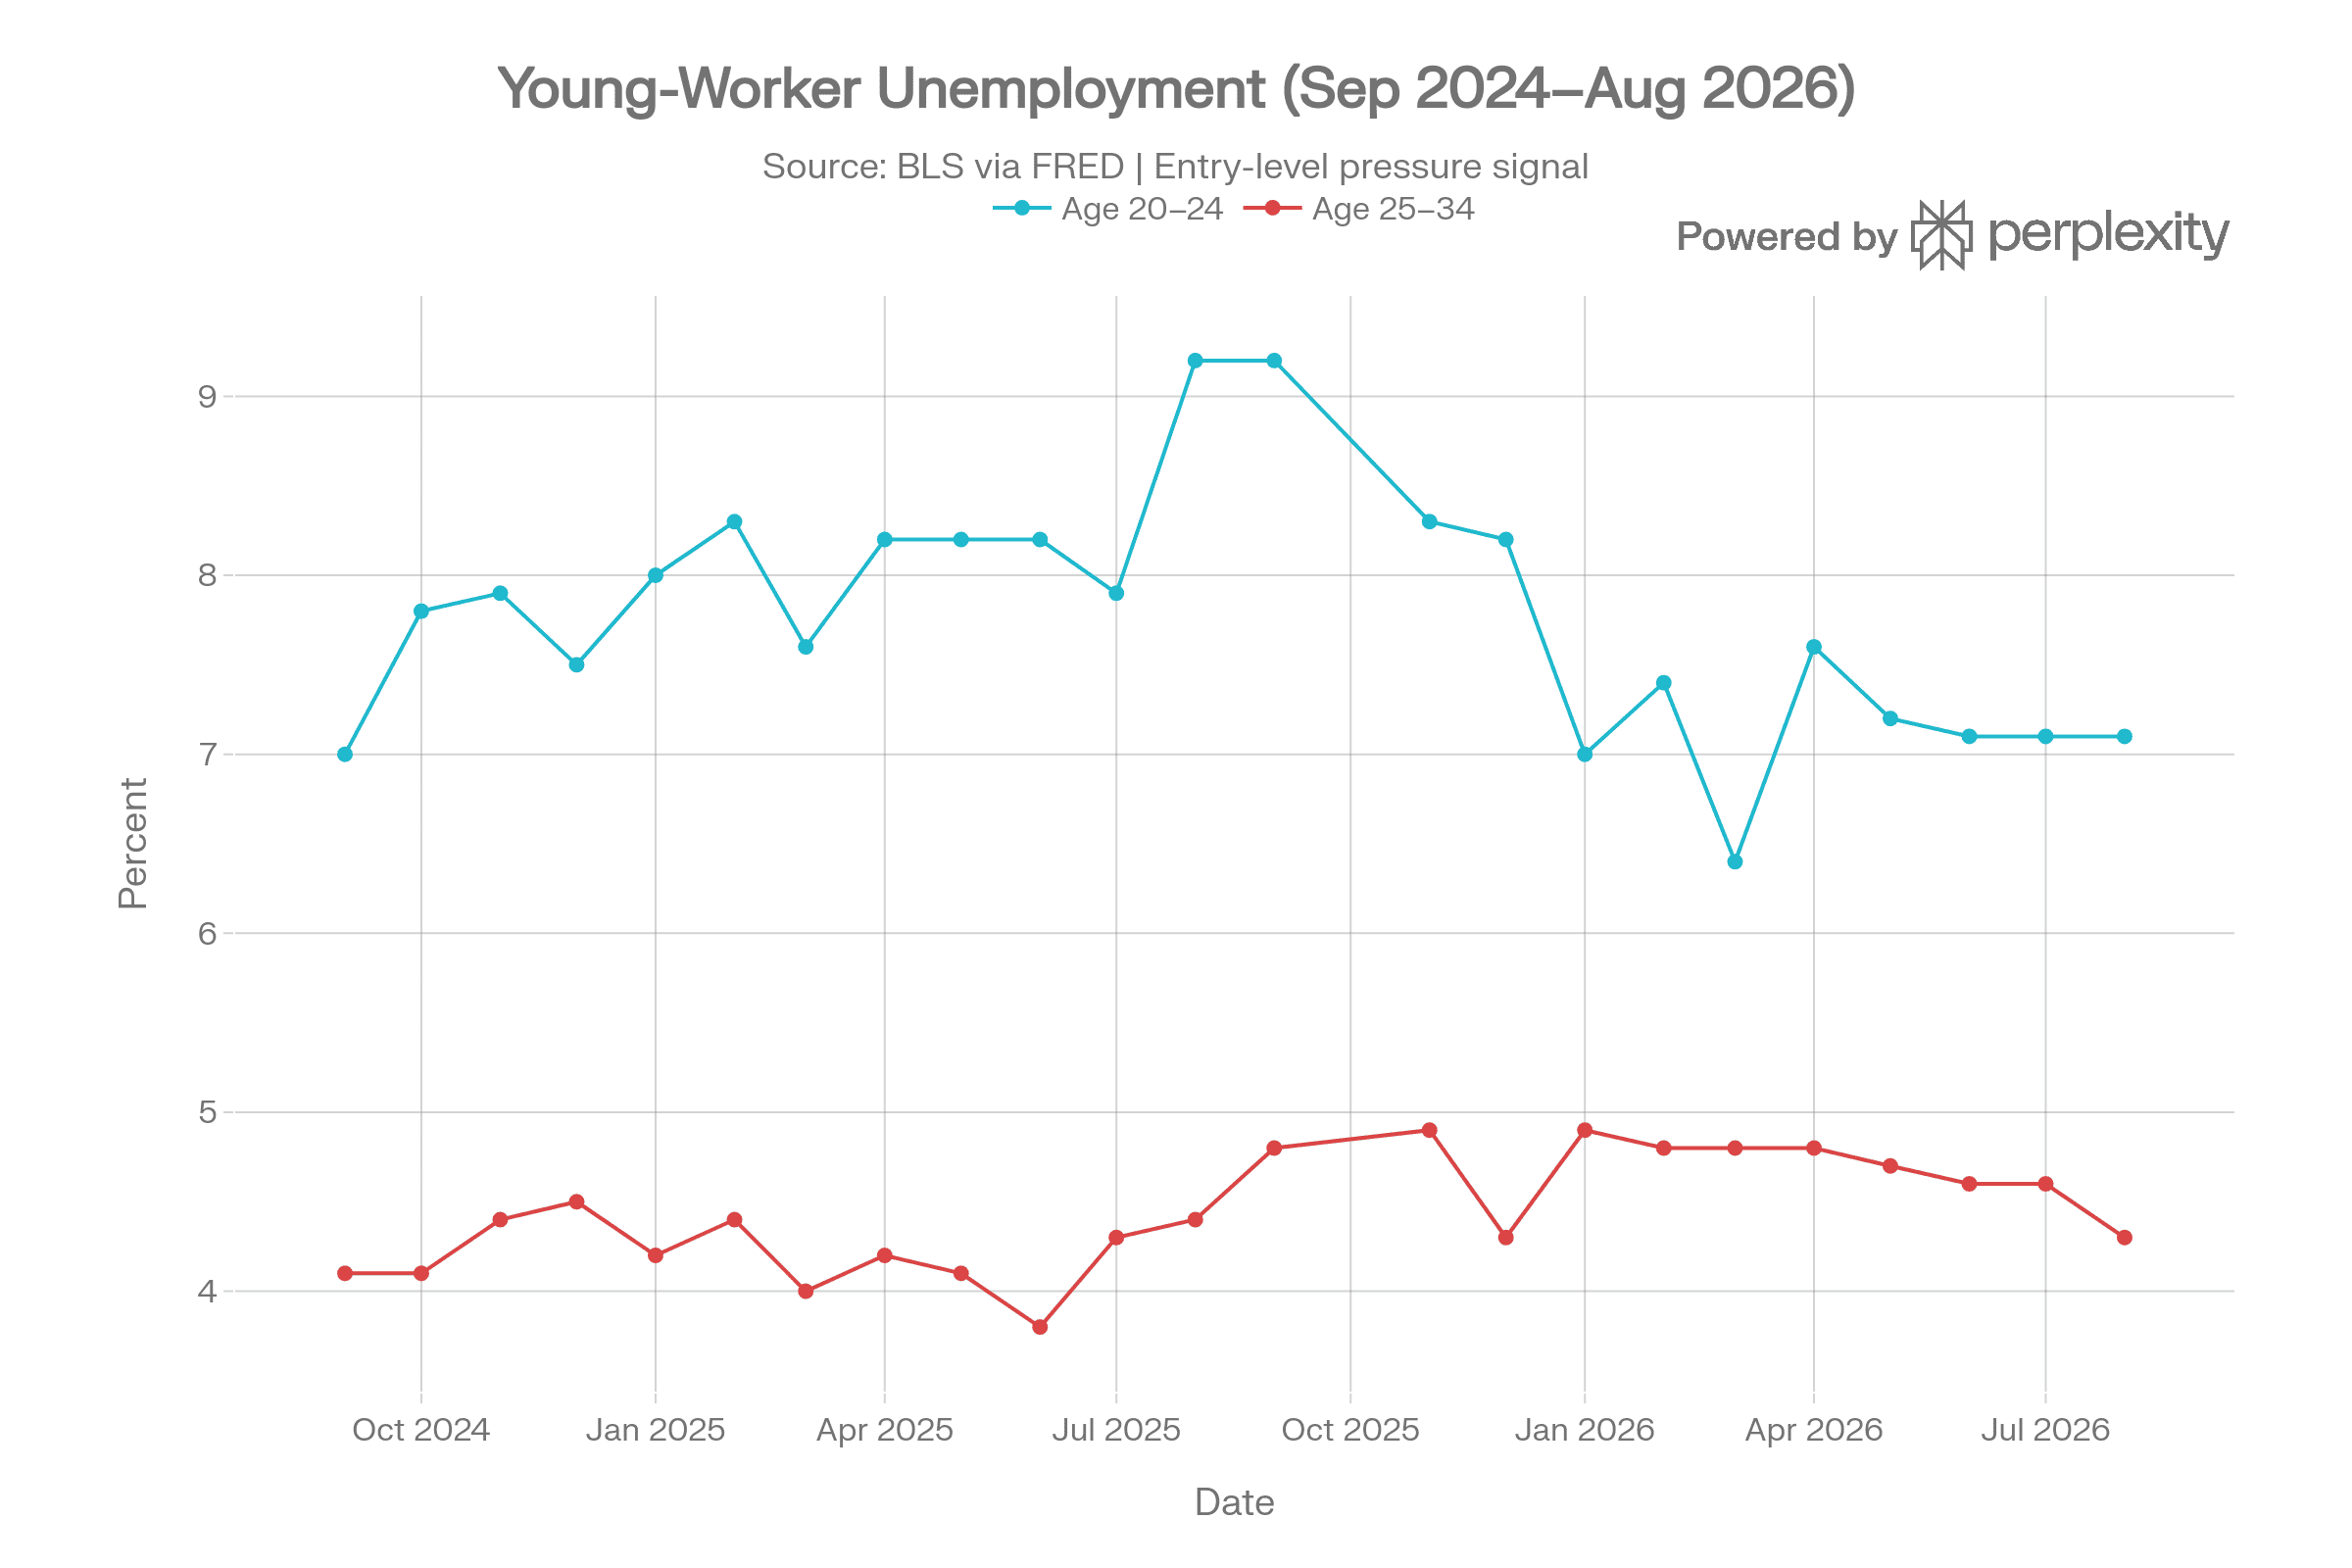
Workers ages 20–24 had a 7.1% unemployment rate in August 2026, compared with 4.3% for workers ages 25–34. The rates were 7.0% and 4.1%, respectively, in September 2024.
Why it matters: Early-career hiring is the most likely place for AI-related task substitution to appear before large layoffs. Employers can preserve experienced staff while reducing junior hiring, internships, training positions, and replacement hiring. That creates a delayed structural risk: a smaller pool of workers develops the skills needed to become experienced professionals, supervisors, operators, auditors, and managers.
Total Job Openings
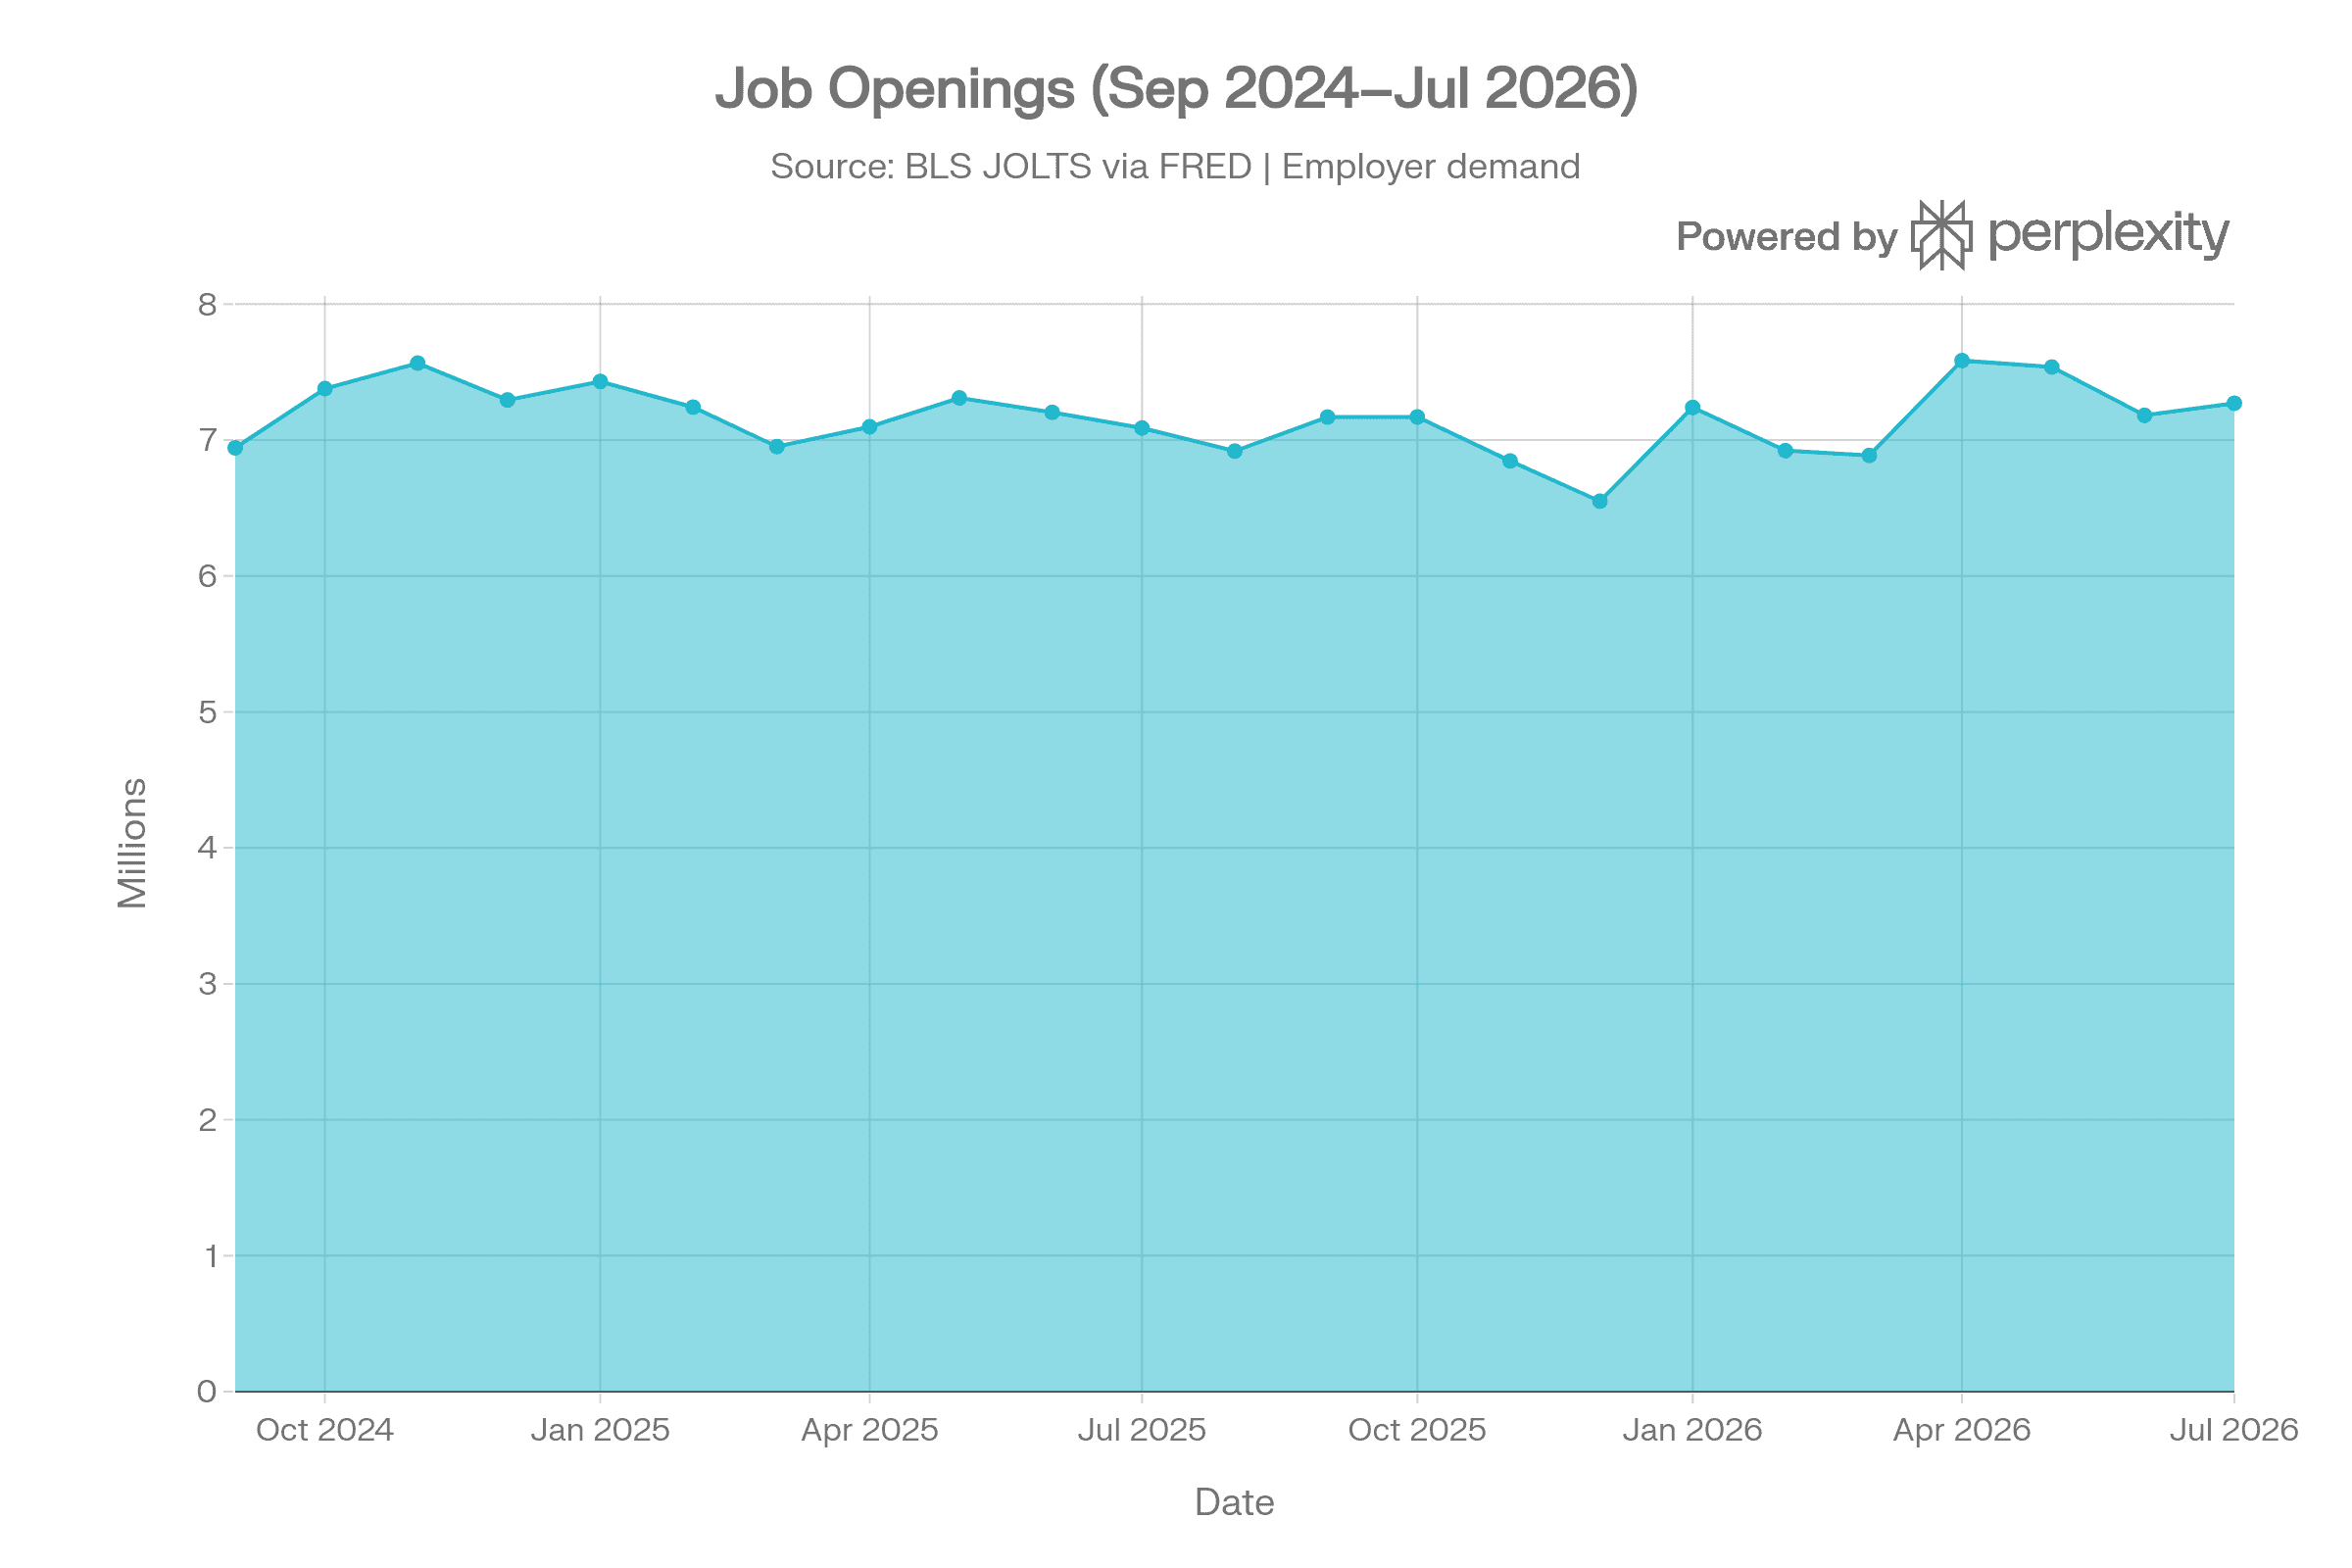
Total job openings increased from about 6.94 million in September 2024 to 7.27 million in July 2026.
Why it matters: Job openings measure employer demand and help distinguish broad labor-market collapse from more specific matching or hiring problems. Rising vacancies are reassuring in isolation, but they do not prove that jobs are accessible to displaced workers, located in affected communities, suitable for entry-level applicants, or sufficient to replace stable jobs with comparable pay and benefits.
Actual Worker Hires
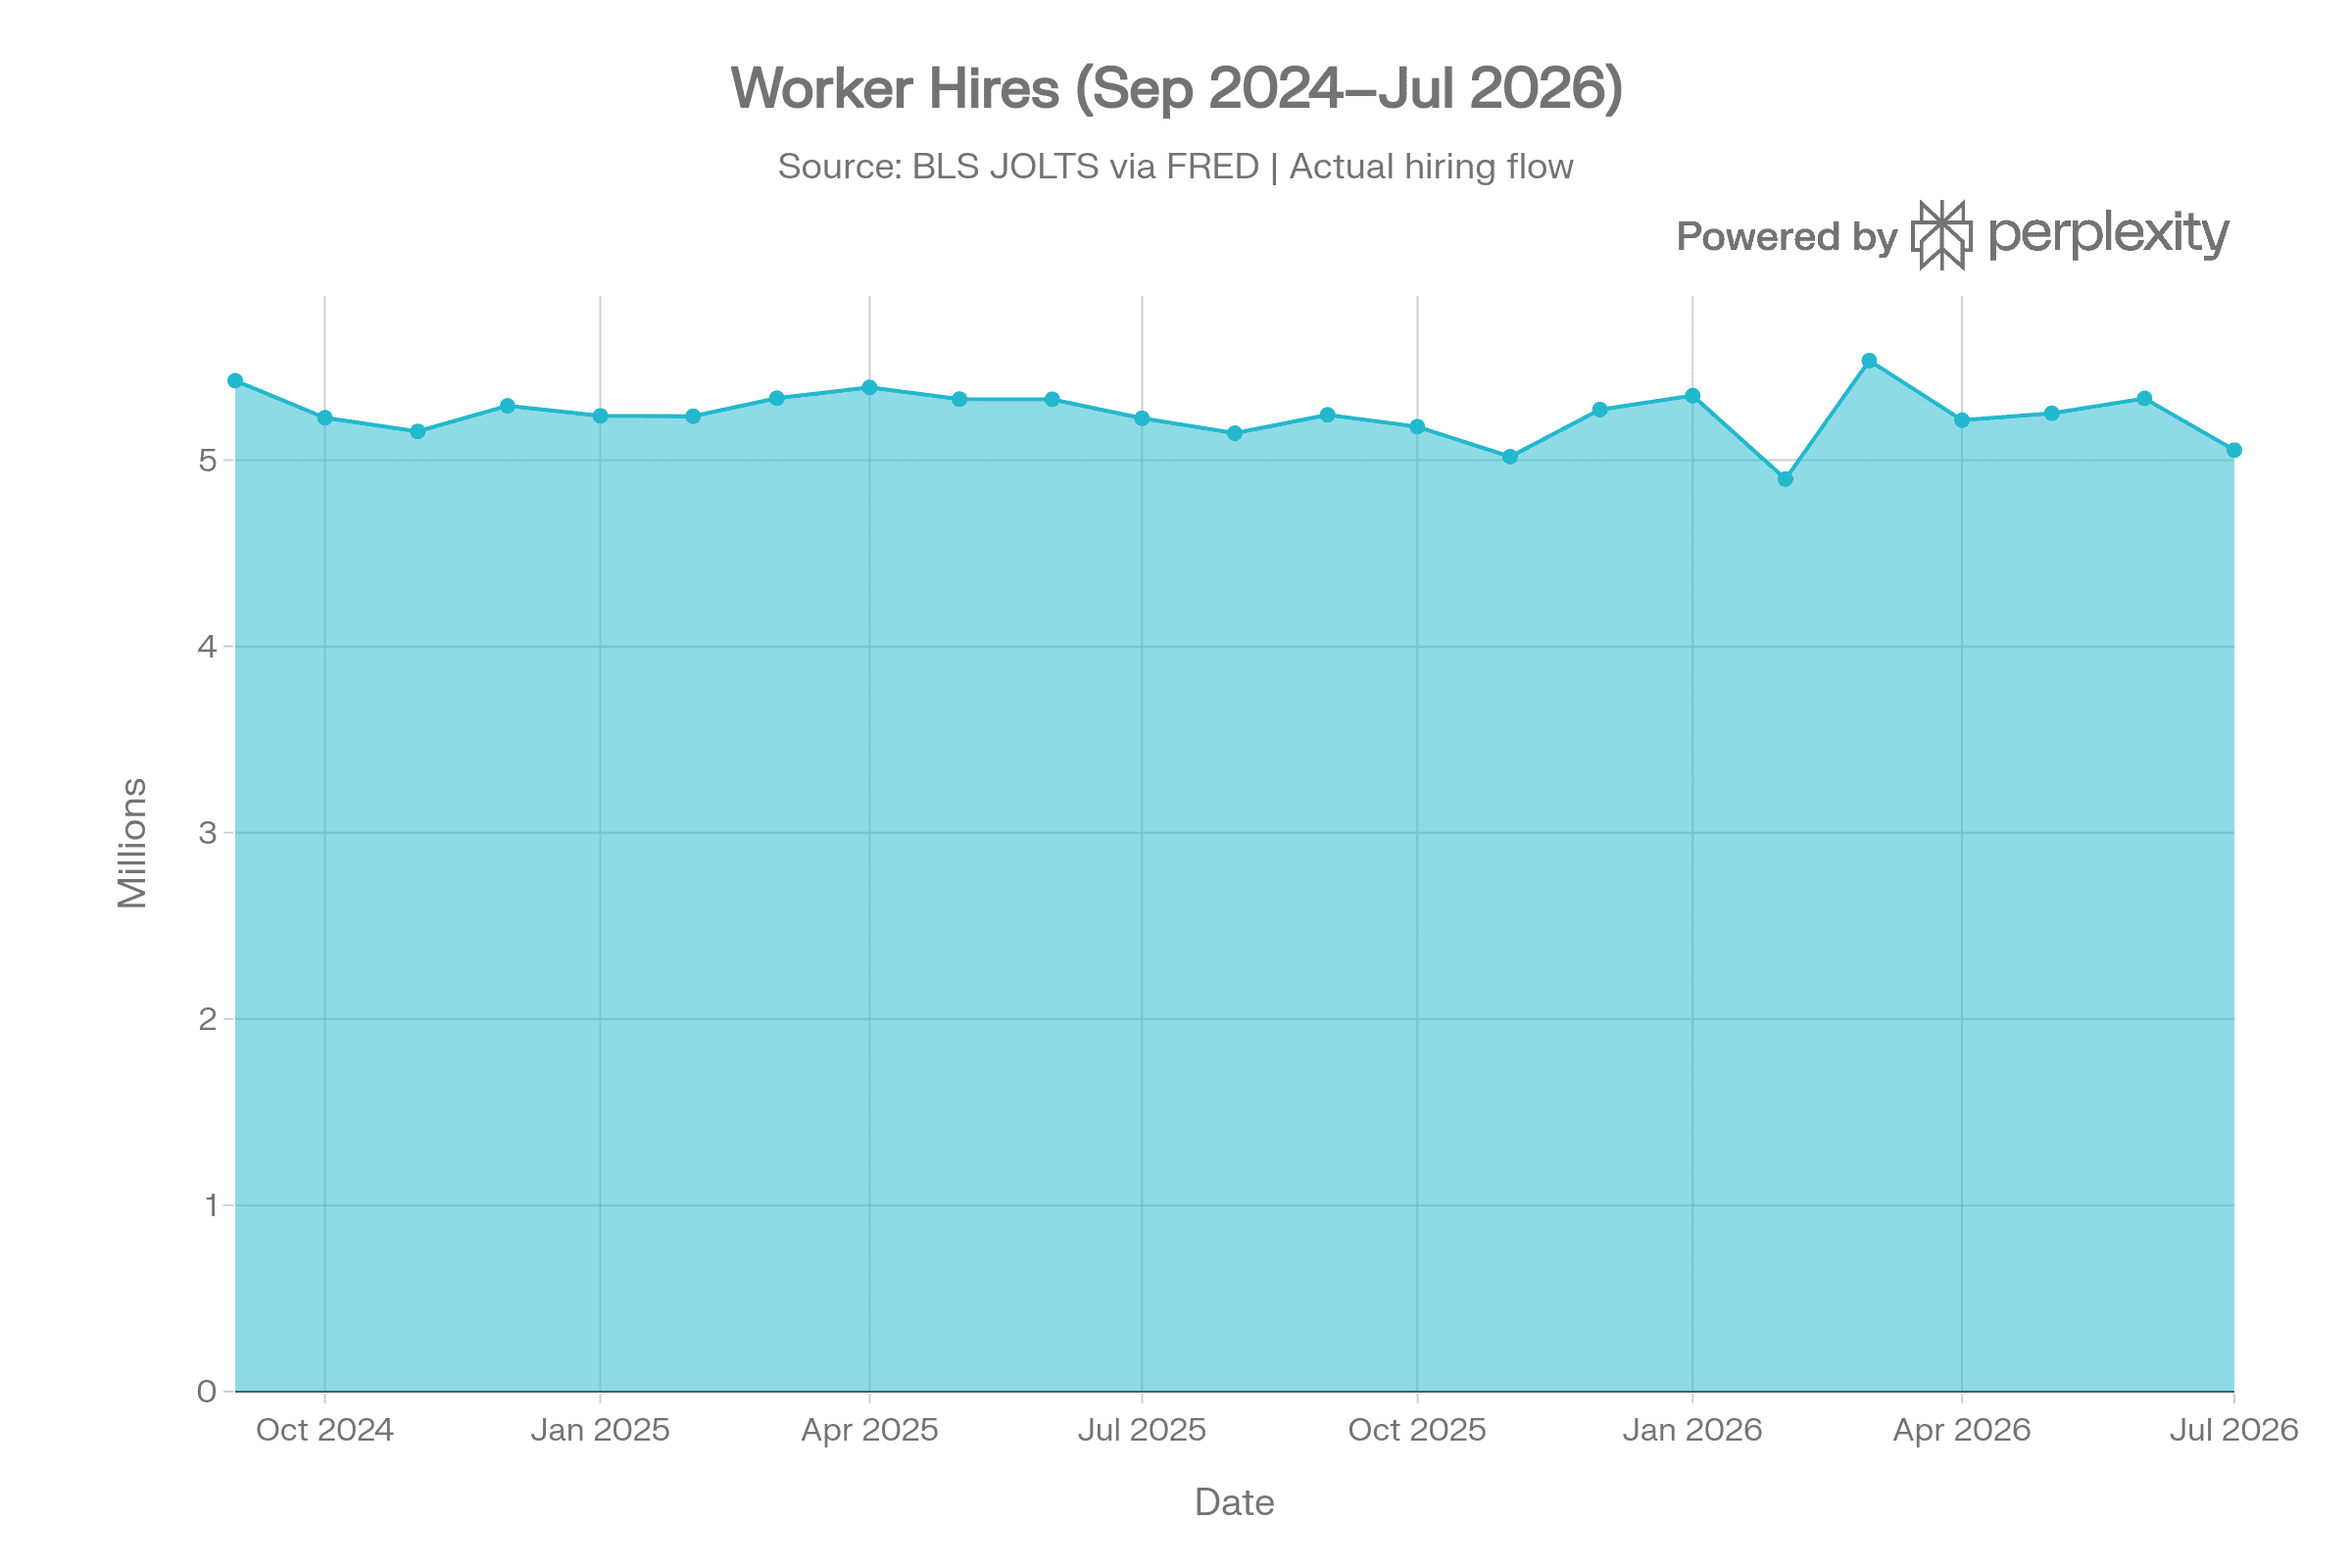
Monthly hires decreased from about 5.43 million in September 2024 to 5.05 million in July 2026.
Why it matters: Hires measure completed employment matches rather than advertised opportunities. A sustained fall in hires alongside available openings can warn of slower matching, greater employer selectivity, delayed recruiting, skills mismatch, or reduced willingness to train entrants. This indicator should be reviewed together with youth unemployment, job openings, and long-term unemployment.
Broad Underemployment: U-6
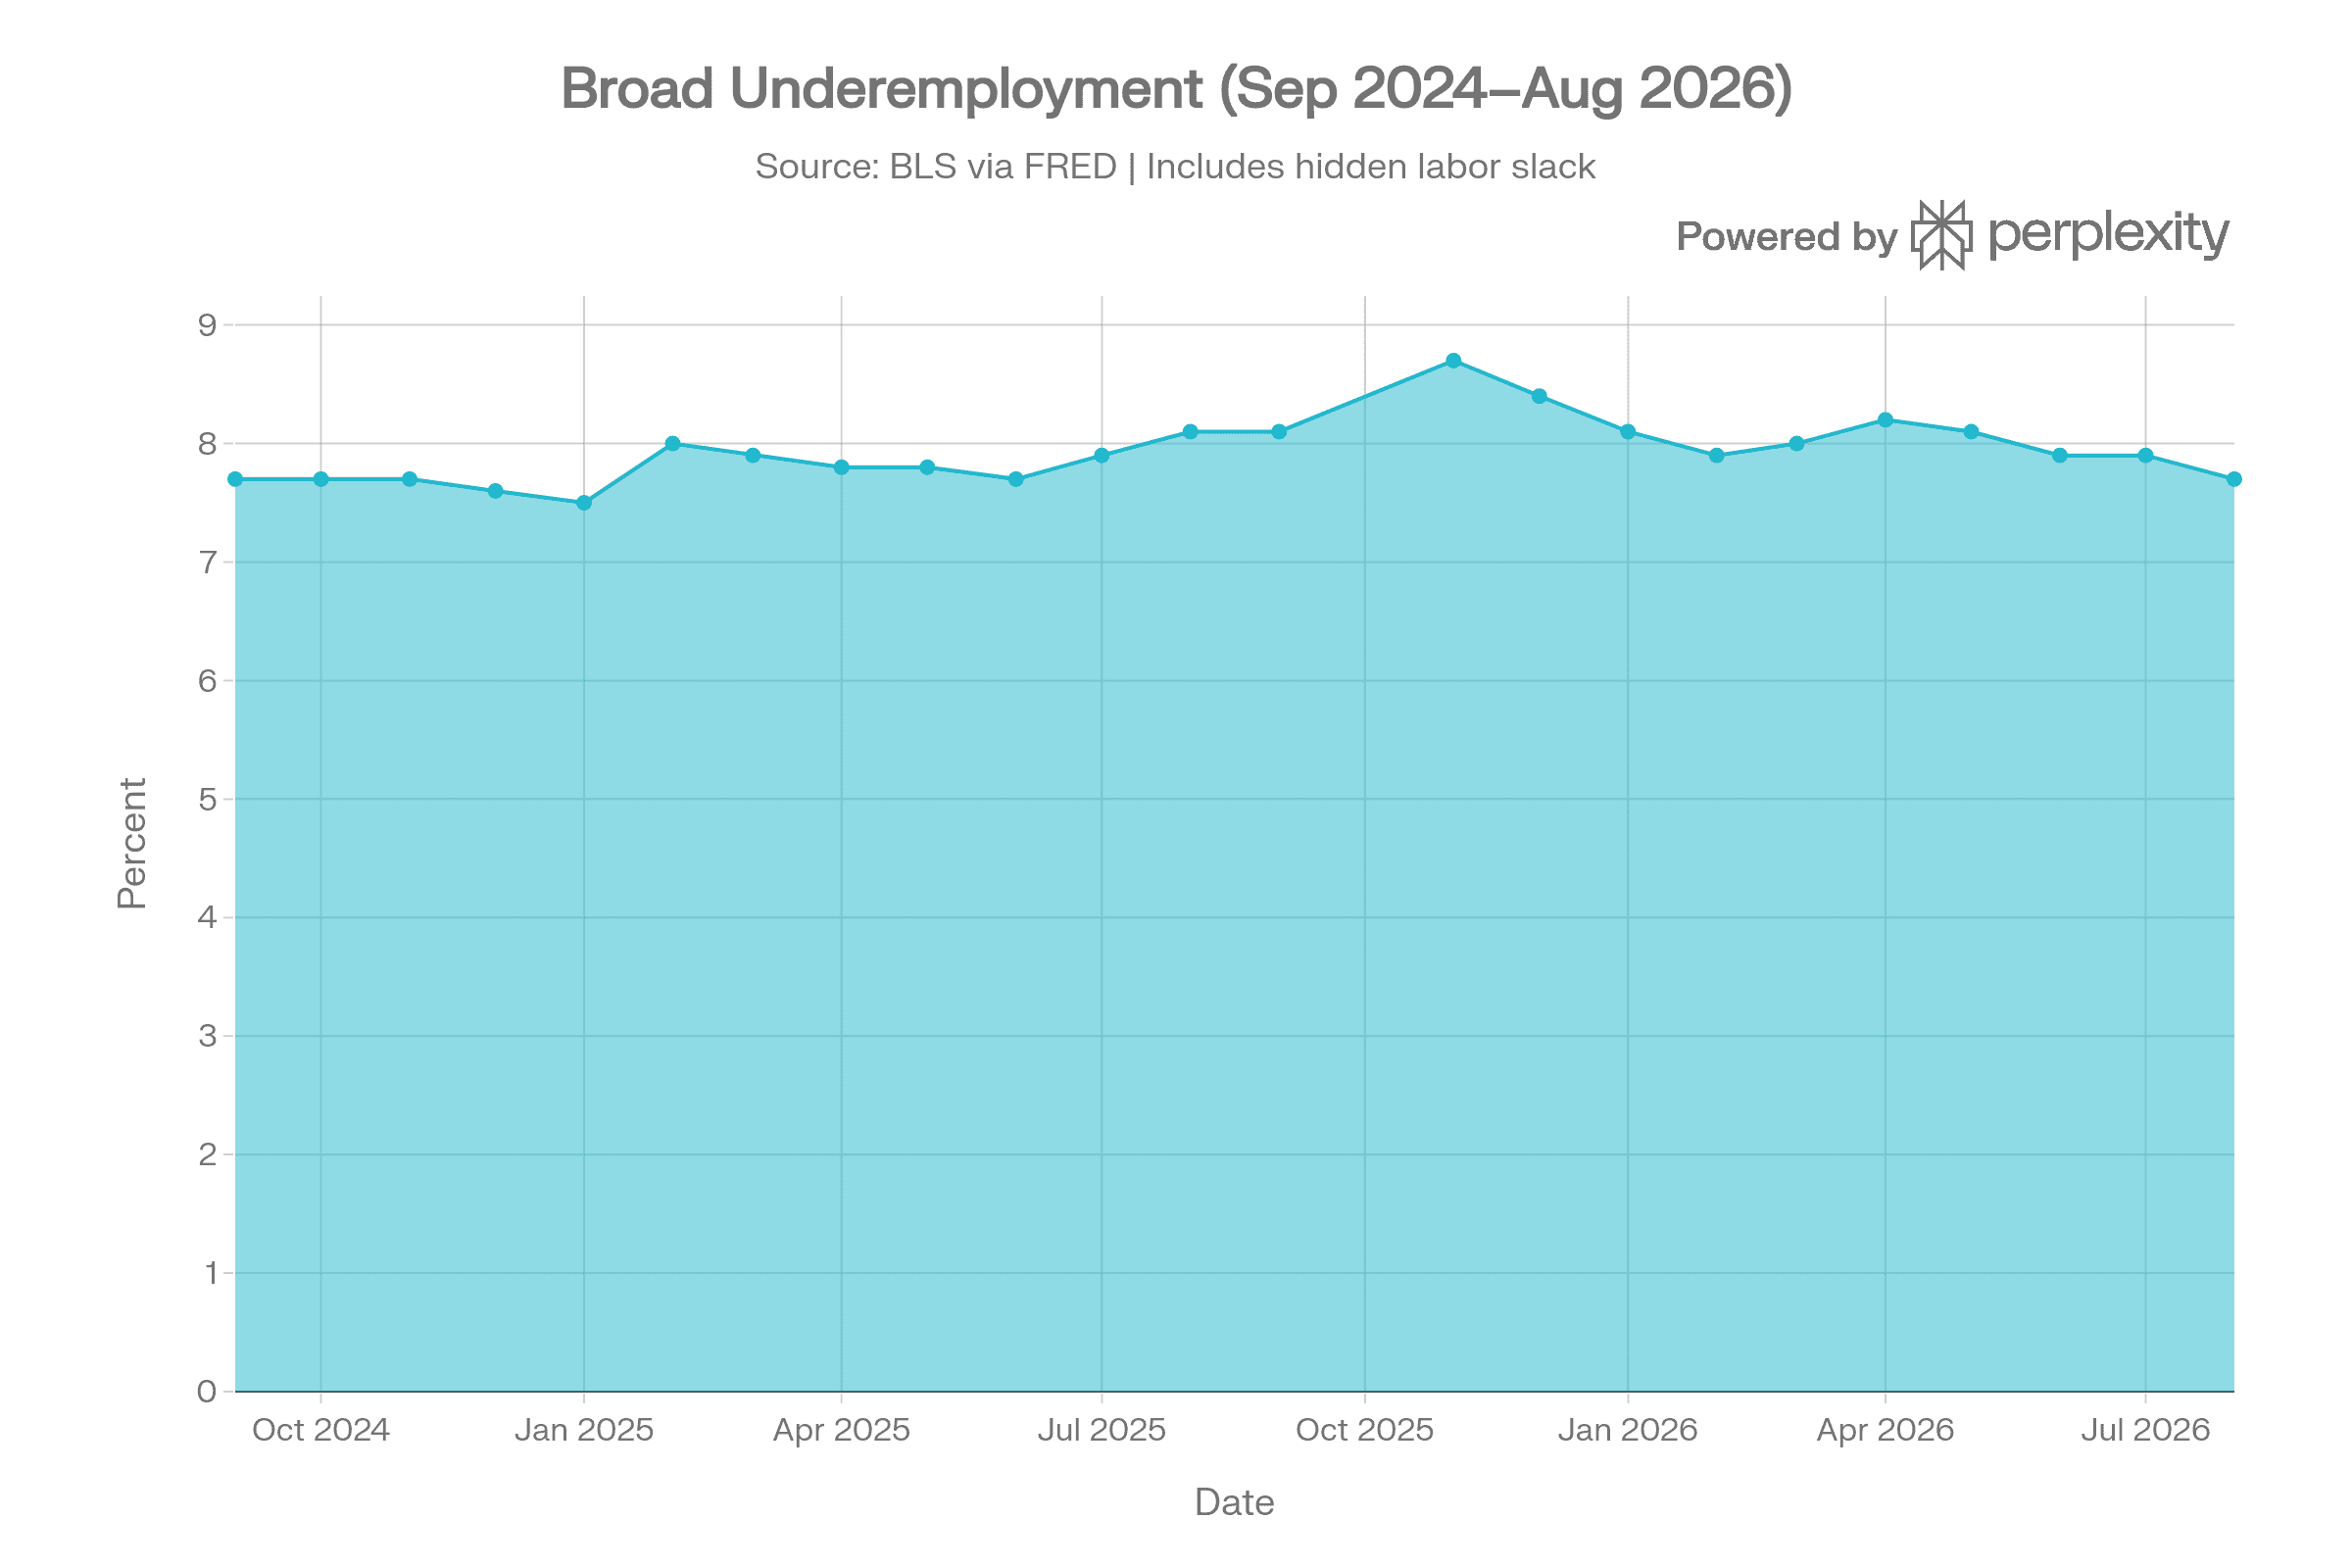
The U-6 underemployment rate was 7.7% in August 2026, the same level reported in September 2024.
Why it matters: U-6 is broader than the official unemployment rate. It includes unemployed people, marginally attached workers, and people working part time for economic reasons. Stability is a counterweight to the negative scenario, but it does not eliminate the possibility of concentrated harm by age, occupation, or region.
Long-Term Unemployment
The number of people unemployed for 27 weeks or longer rose from about 1.61 million in September 2024 to approximately 1.93 million in August 2026, an increase of nearly 20%.
Why it matters: Long-duration unemployment is a core civil-continuity indicator. Longer spells without work can reflect weak demand, skill mismatch, geographic barriers, health limitations, caregiving constraints, or loss of market value for prior skills. Prolonged displacement also increases the likelihood of savings depletion, housing instability, loss of health coverage, social isolation, and psychological harm.
(Chart shown at the top of this report.)
Continued Unemployment Claims
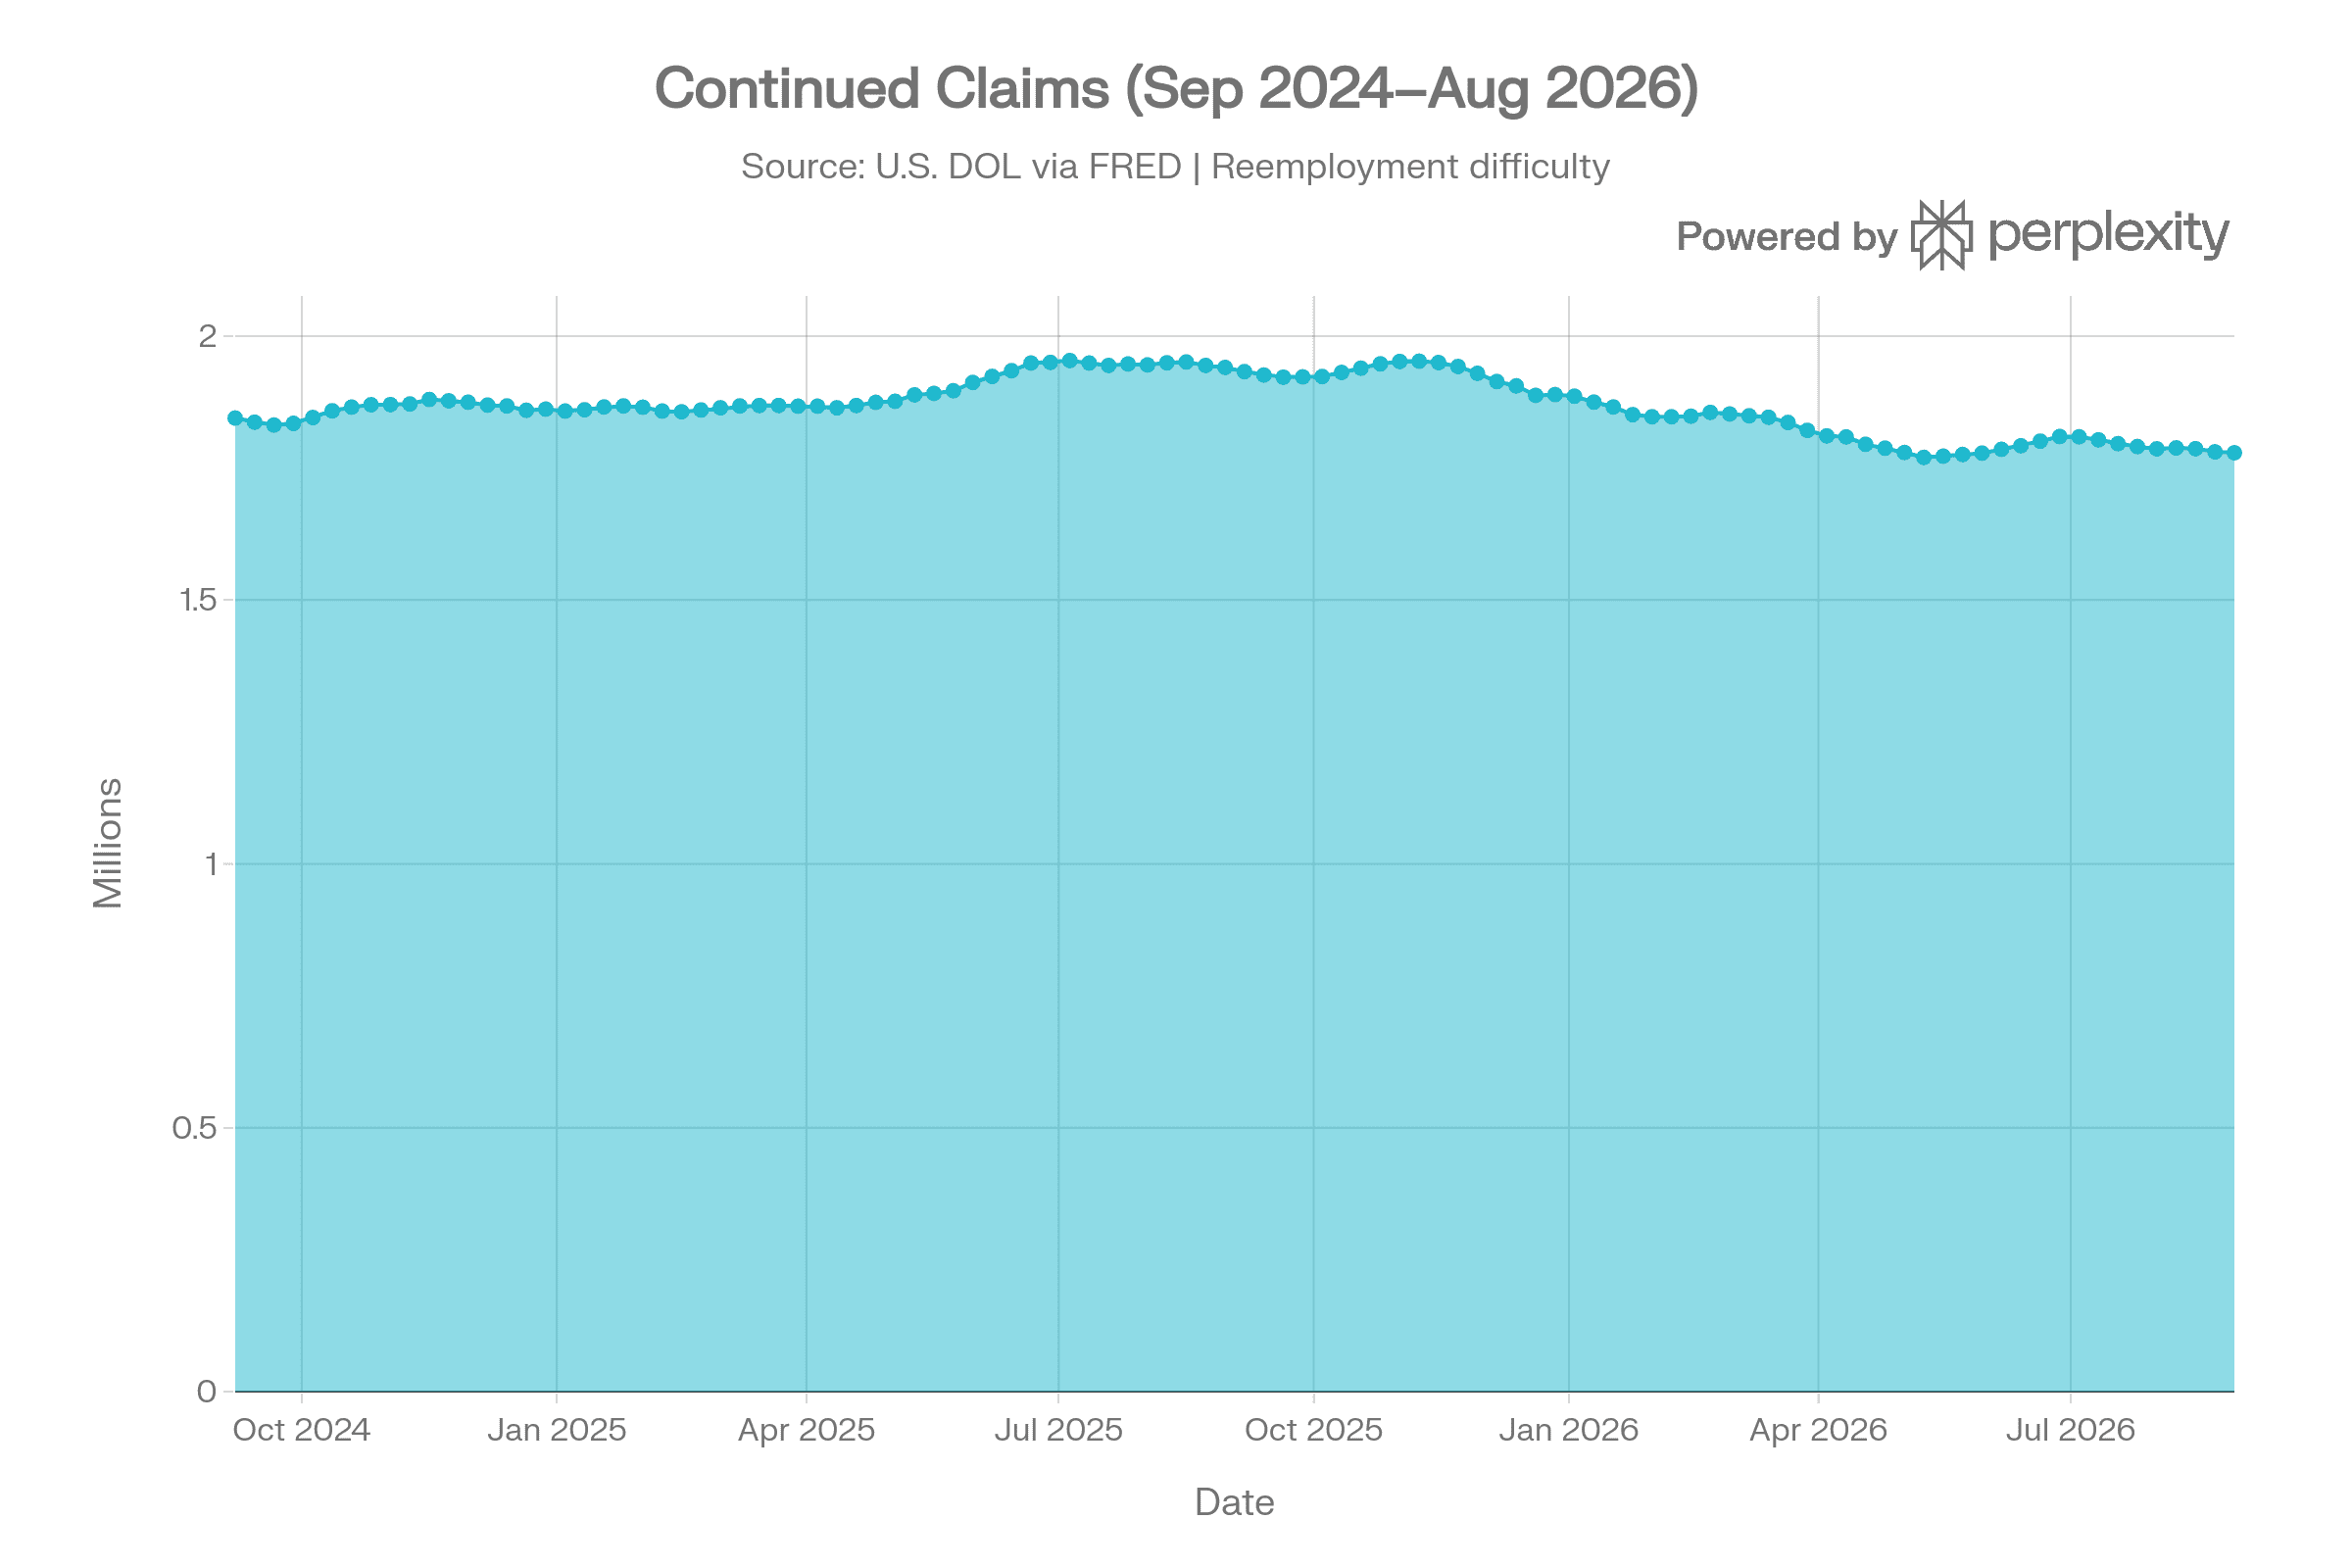
The four-week moving average of continued unemployment claims fell from about 1.845 million in early September 2024 to approximately 1.779 million in late August 2026.
Why it matters: Continued claims indicate the number of insured workers who remain unemployed after filing an initial claim. A decline is a positive signal for the covered population. The measure nevertheless excludes many workers, including some independent contractors, people who exhaust benefits, workers who do not qualify, and people who leave the labor force.
Involuntary Part-Time Employment
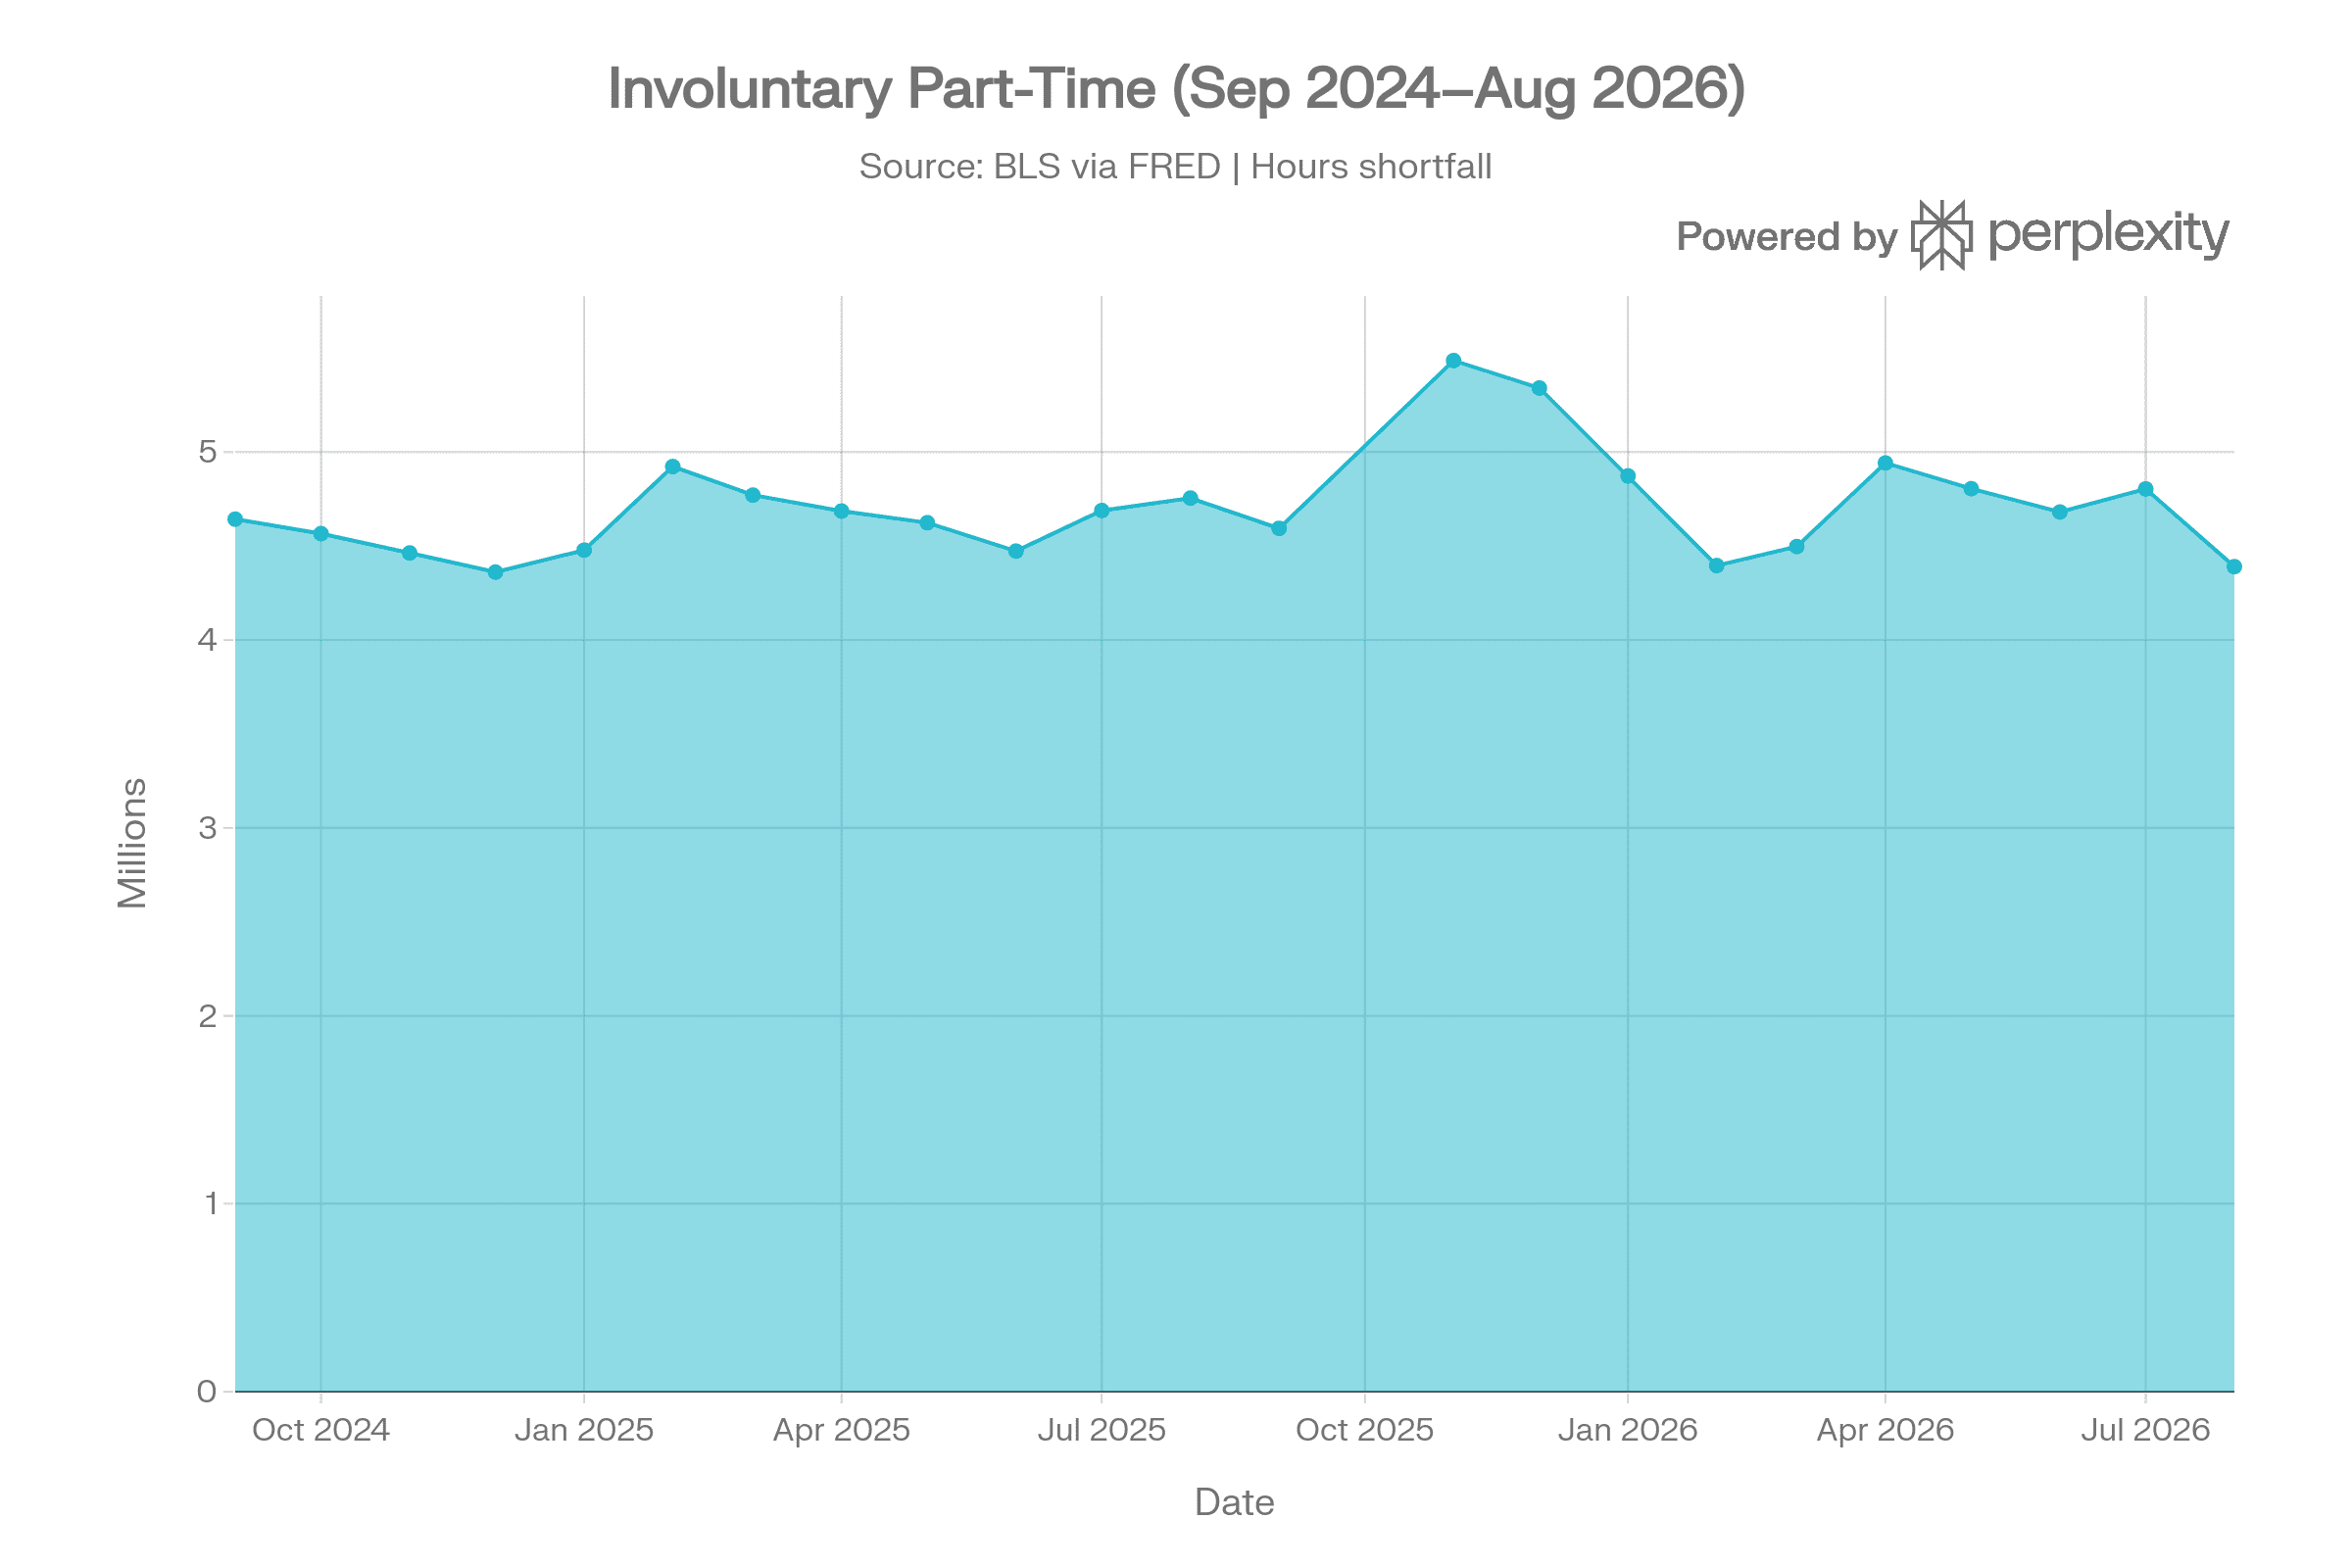
Workers employed part time for economic reasons declined from approximately 4.64 million in September 2024 to 4.39 million in August 2026.
Why it matters: This measure captures people who have work but want full-time hours and cannot obtain them. It is an important indicator of hidden underemployment because households can suffer income and benefit loss while workers are still counted as employed.
Private-Sector Weekly Hours
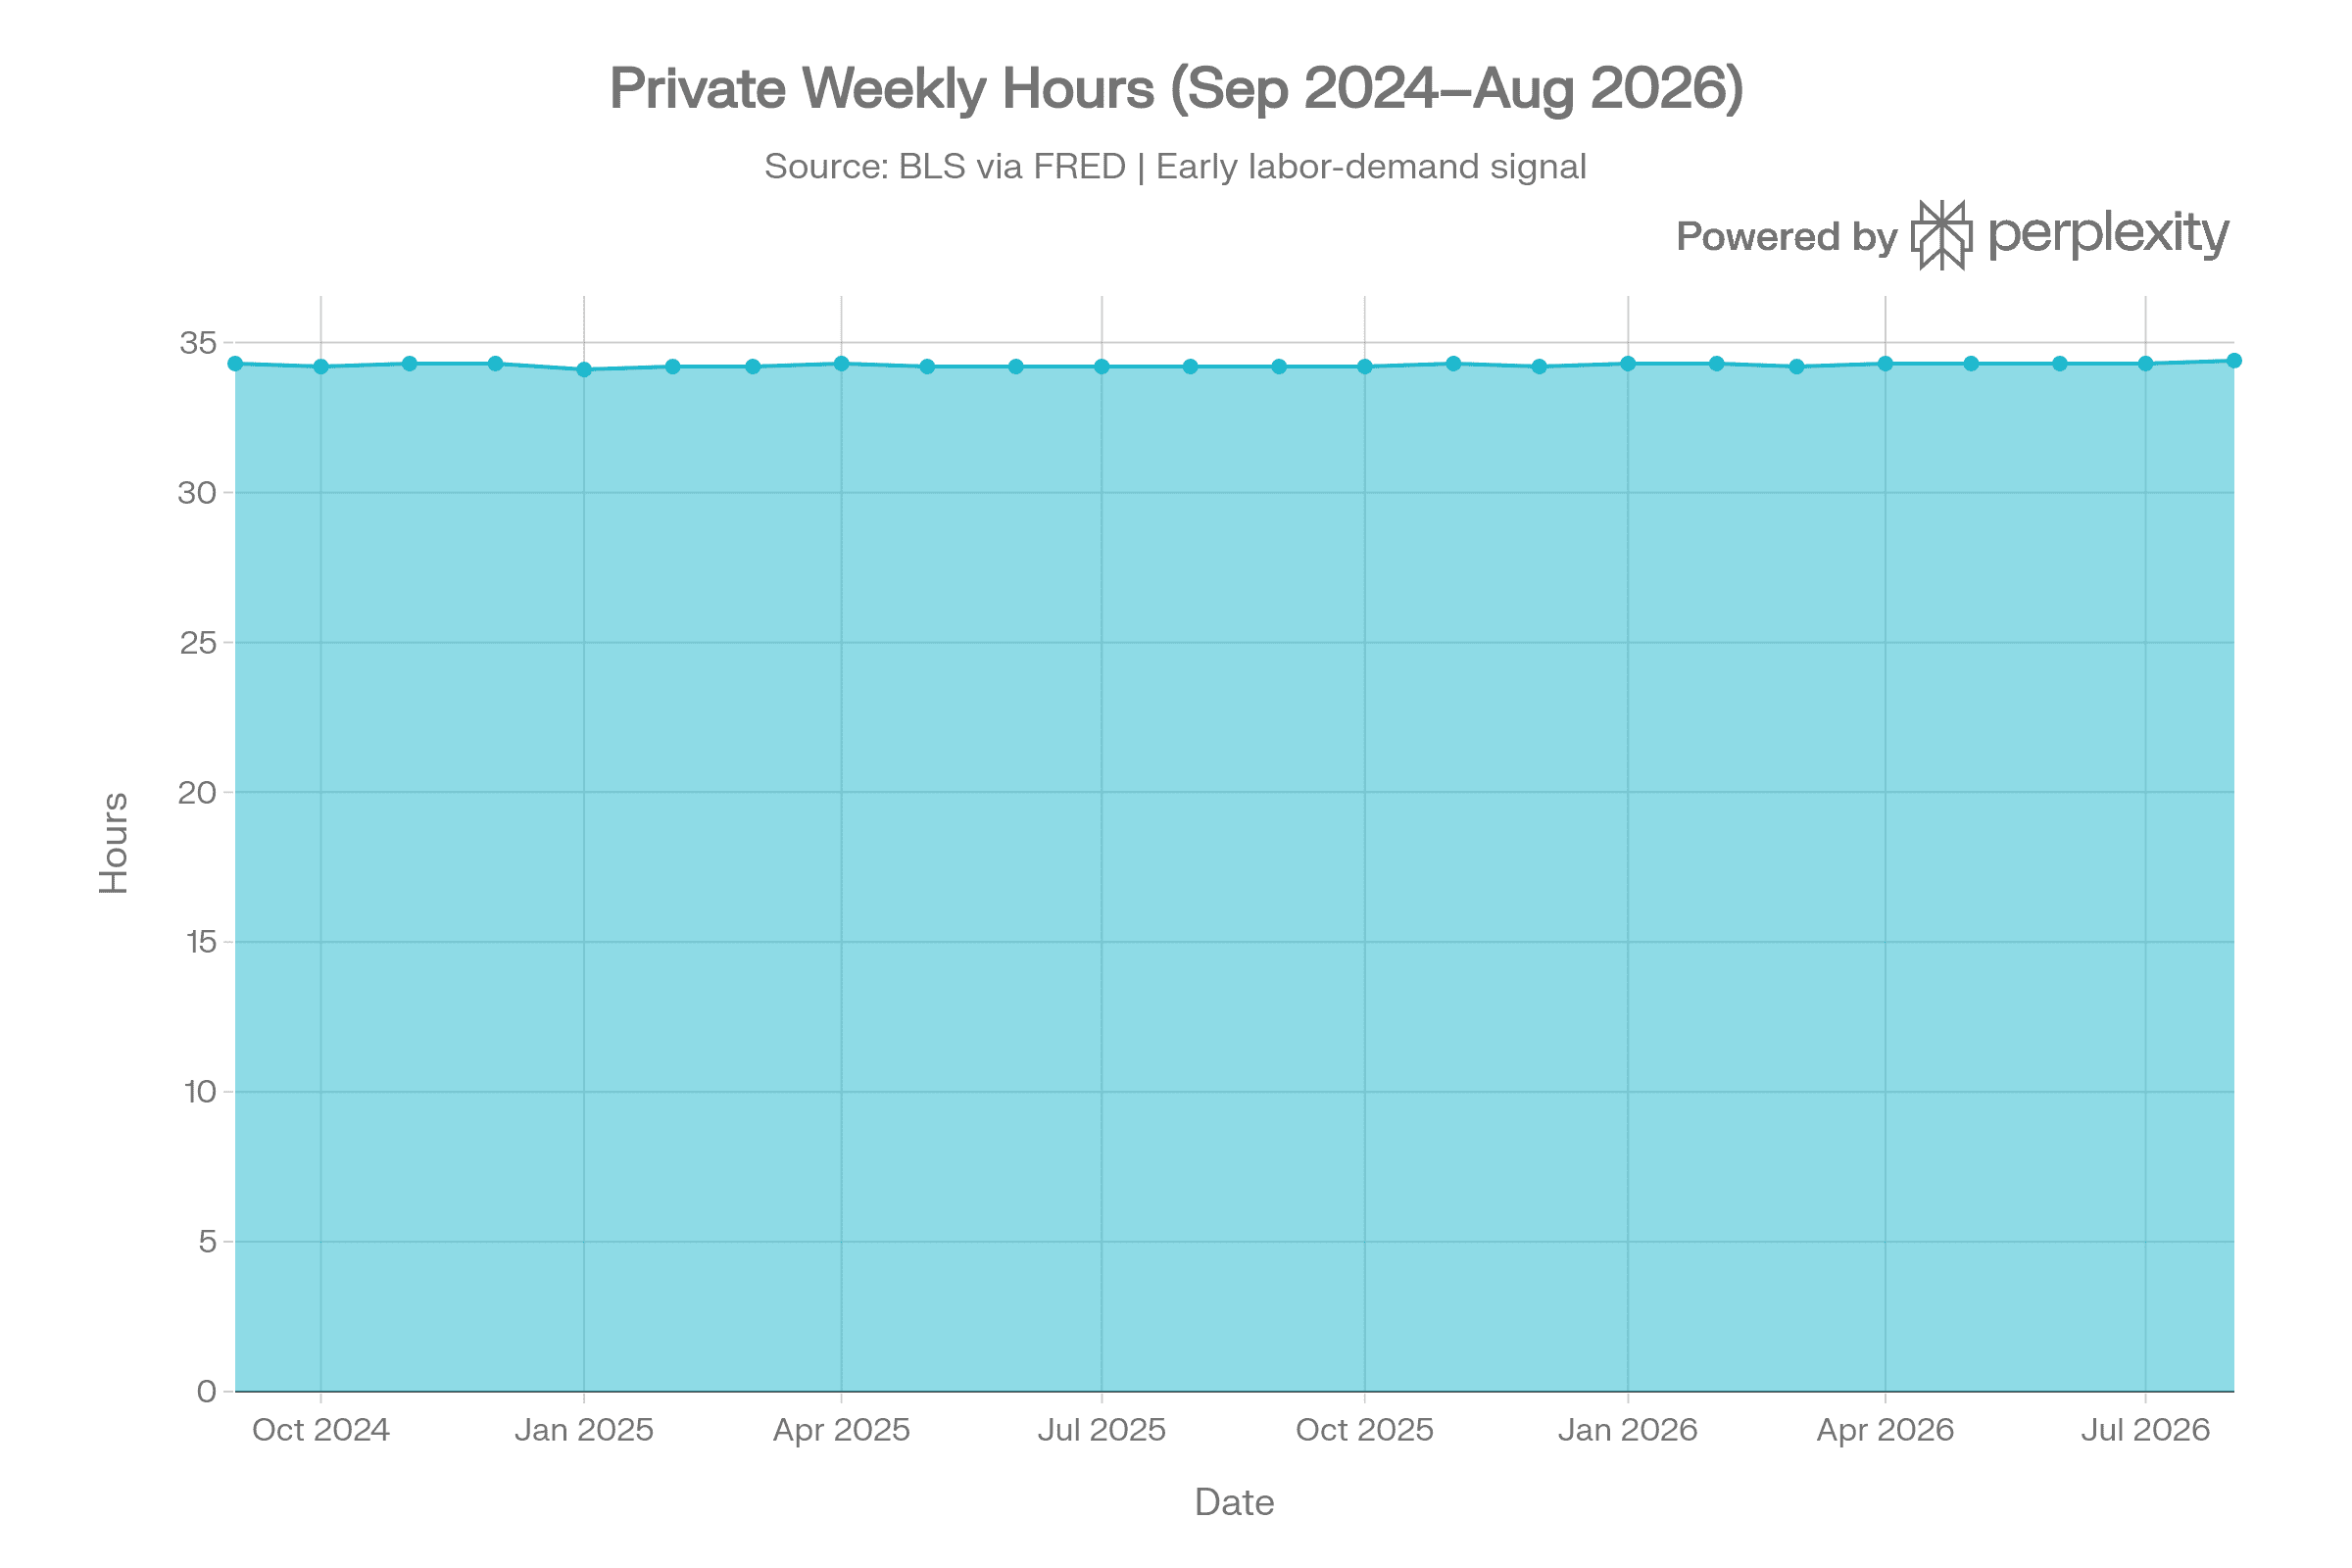
Average weekly hours among private-sector employees were broadly stable, moving from 34.3 hours in September 2024 to 34.4 hours in August 2026.
Why it matters: Employers often reduce hours before reducing headcount. A broad decline in hours would be an early warning that firms are responding to softer demand or higher productivity by shrinking labor inputs. The current near-flat trend does not signal national hours-based contraction.
Inflation-Adjusted Hourly Pay
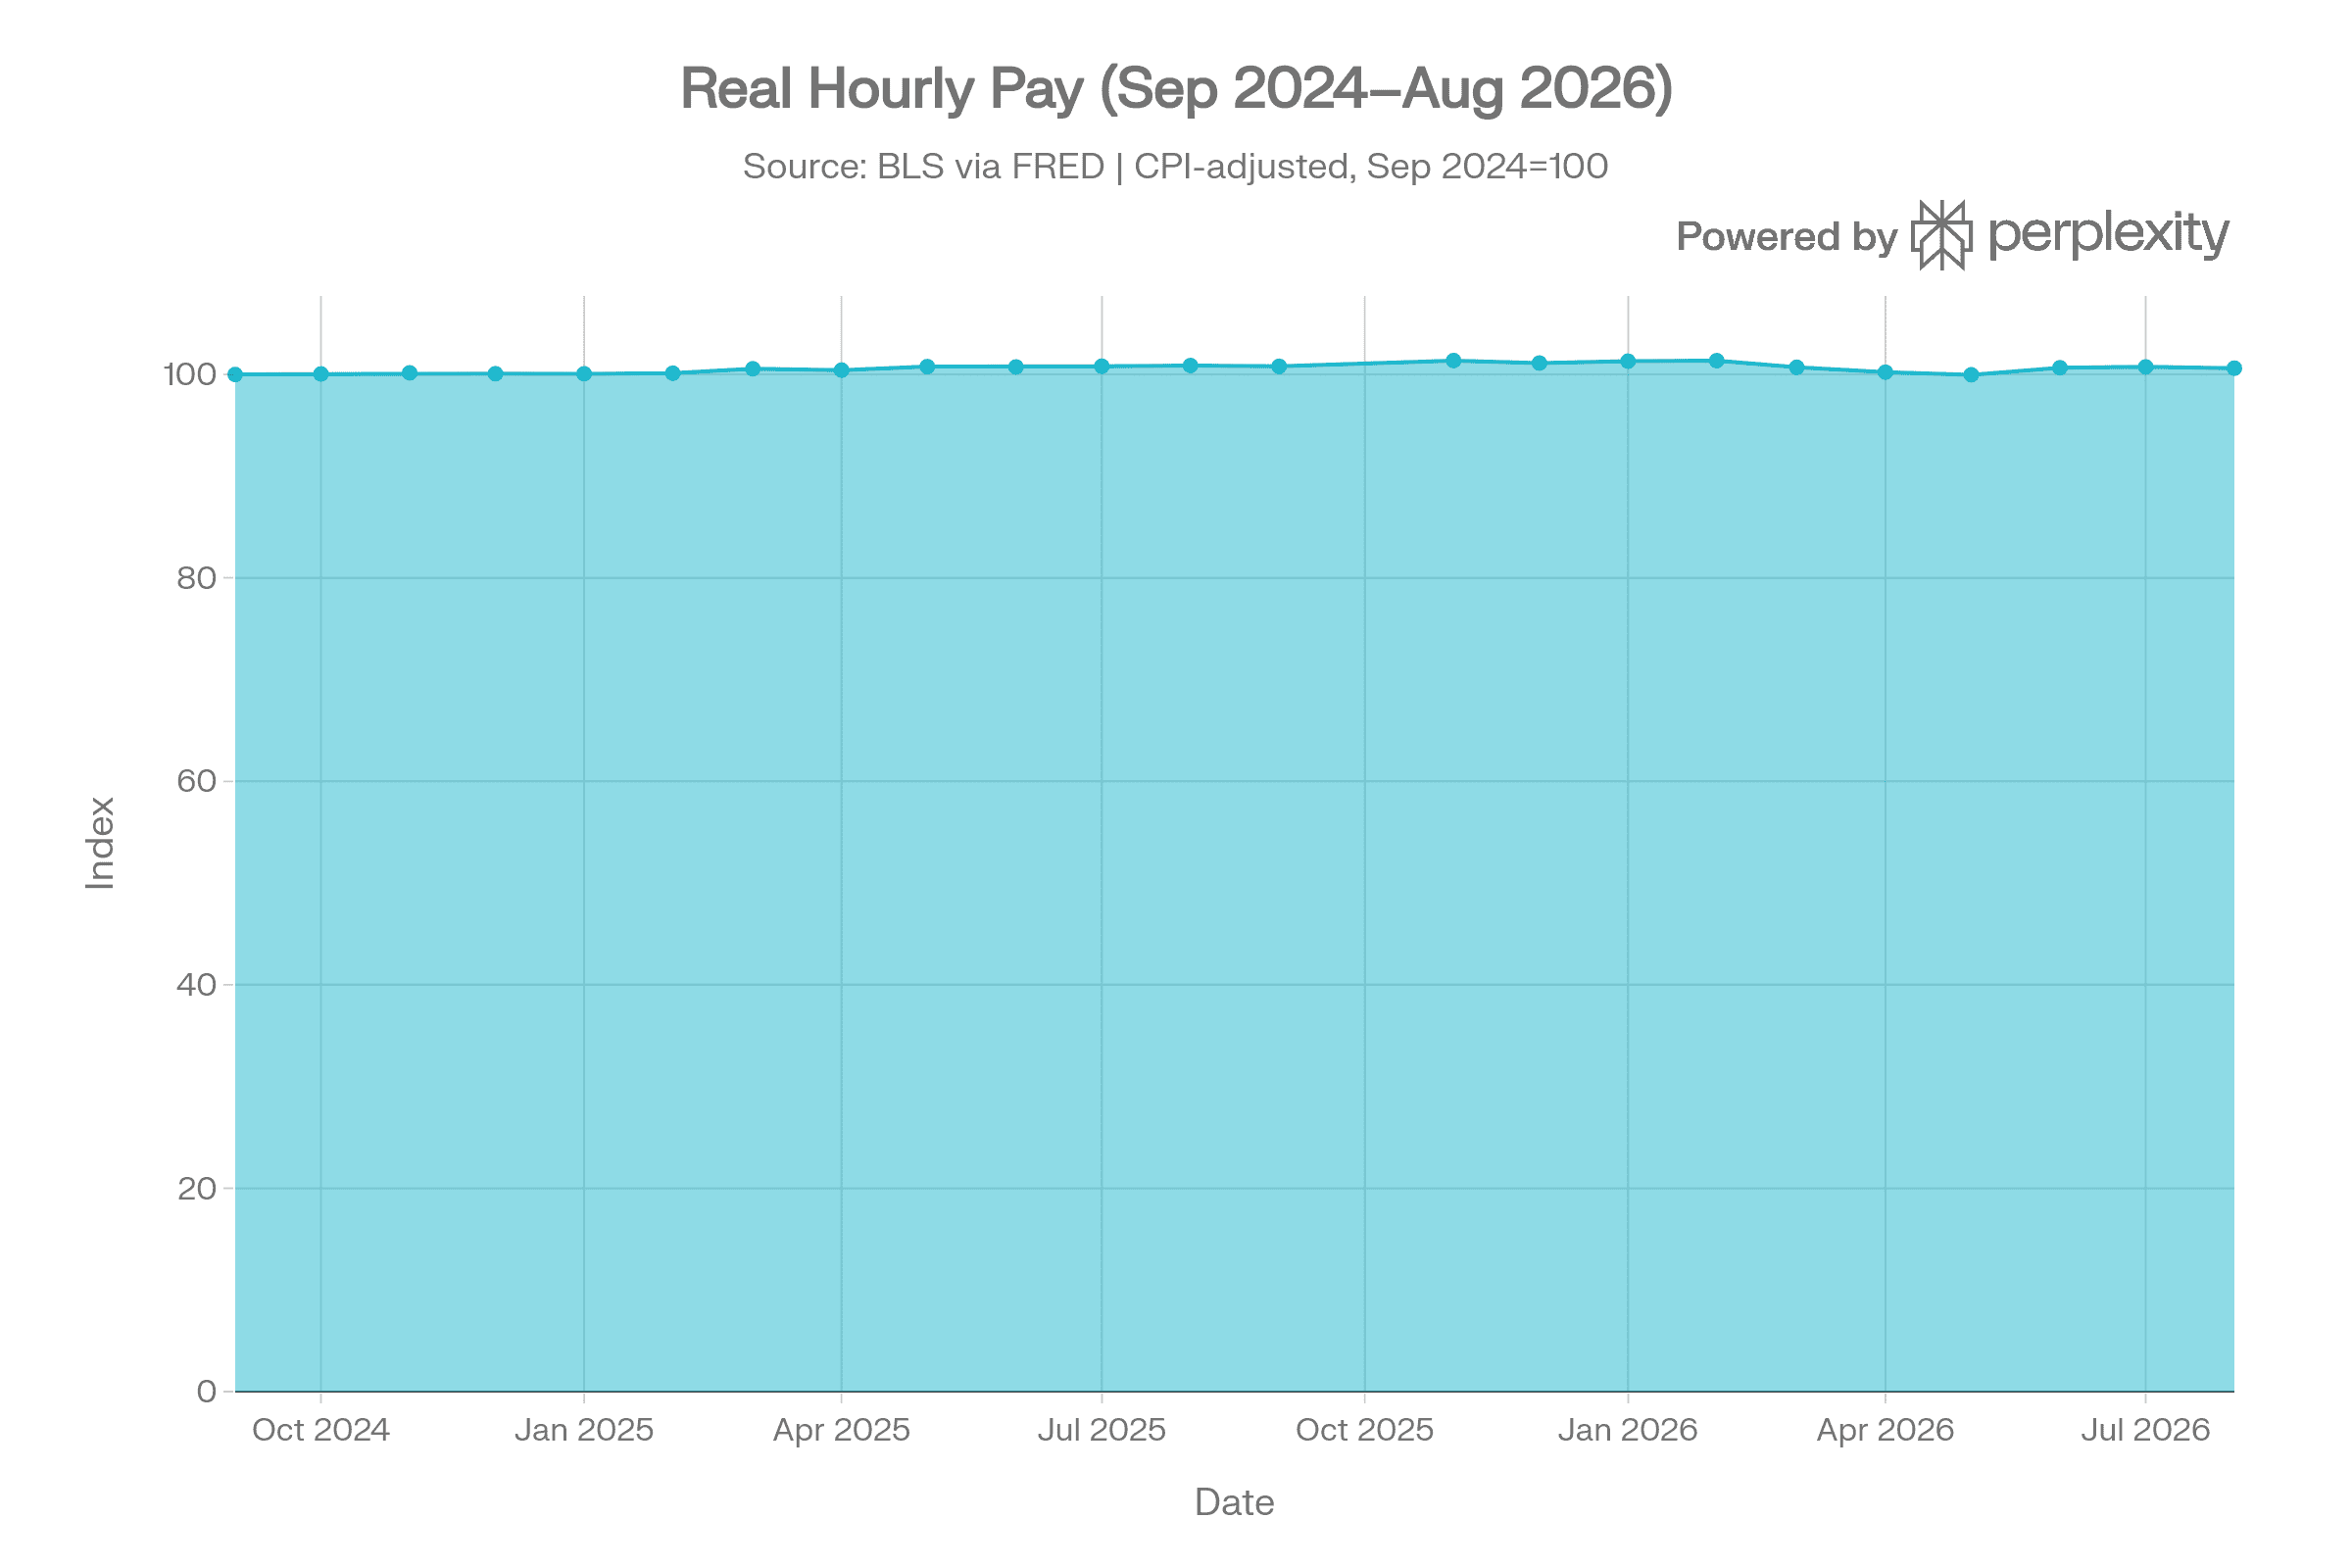
The CPI-adjusted hourly-pay index increased only about 0.6% between September 2024 and August 2026, using September 2024 as an index value of 100.
Why it matters: Employment counts can remain stable while pay, bargaining power, and advancement prospects erode. Weak real-pay growth can indicate wage compression or job-quality deterioration, both of which can contribute to household stress even in a low-unemployment environment.
Prime-Age Labor-Force Participation
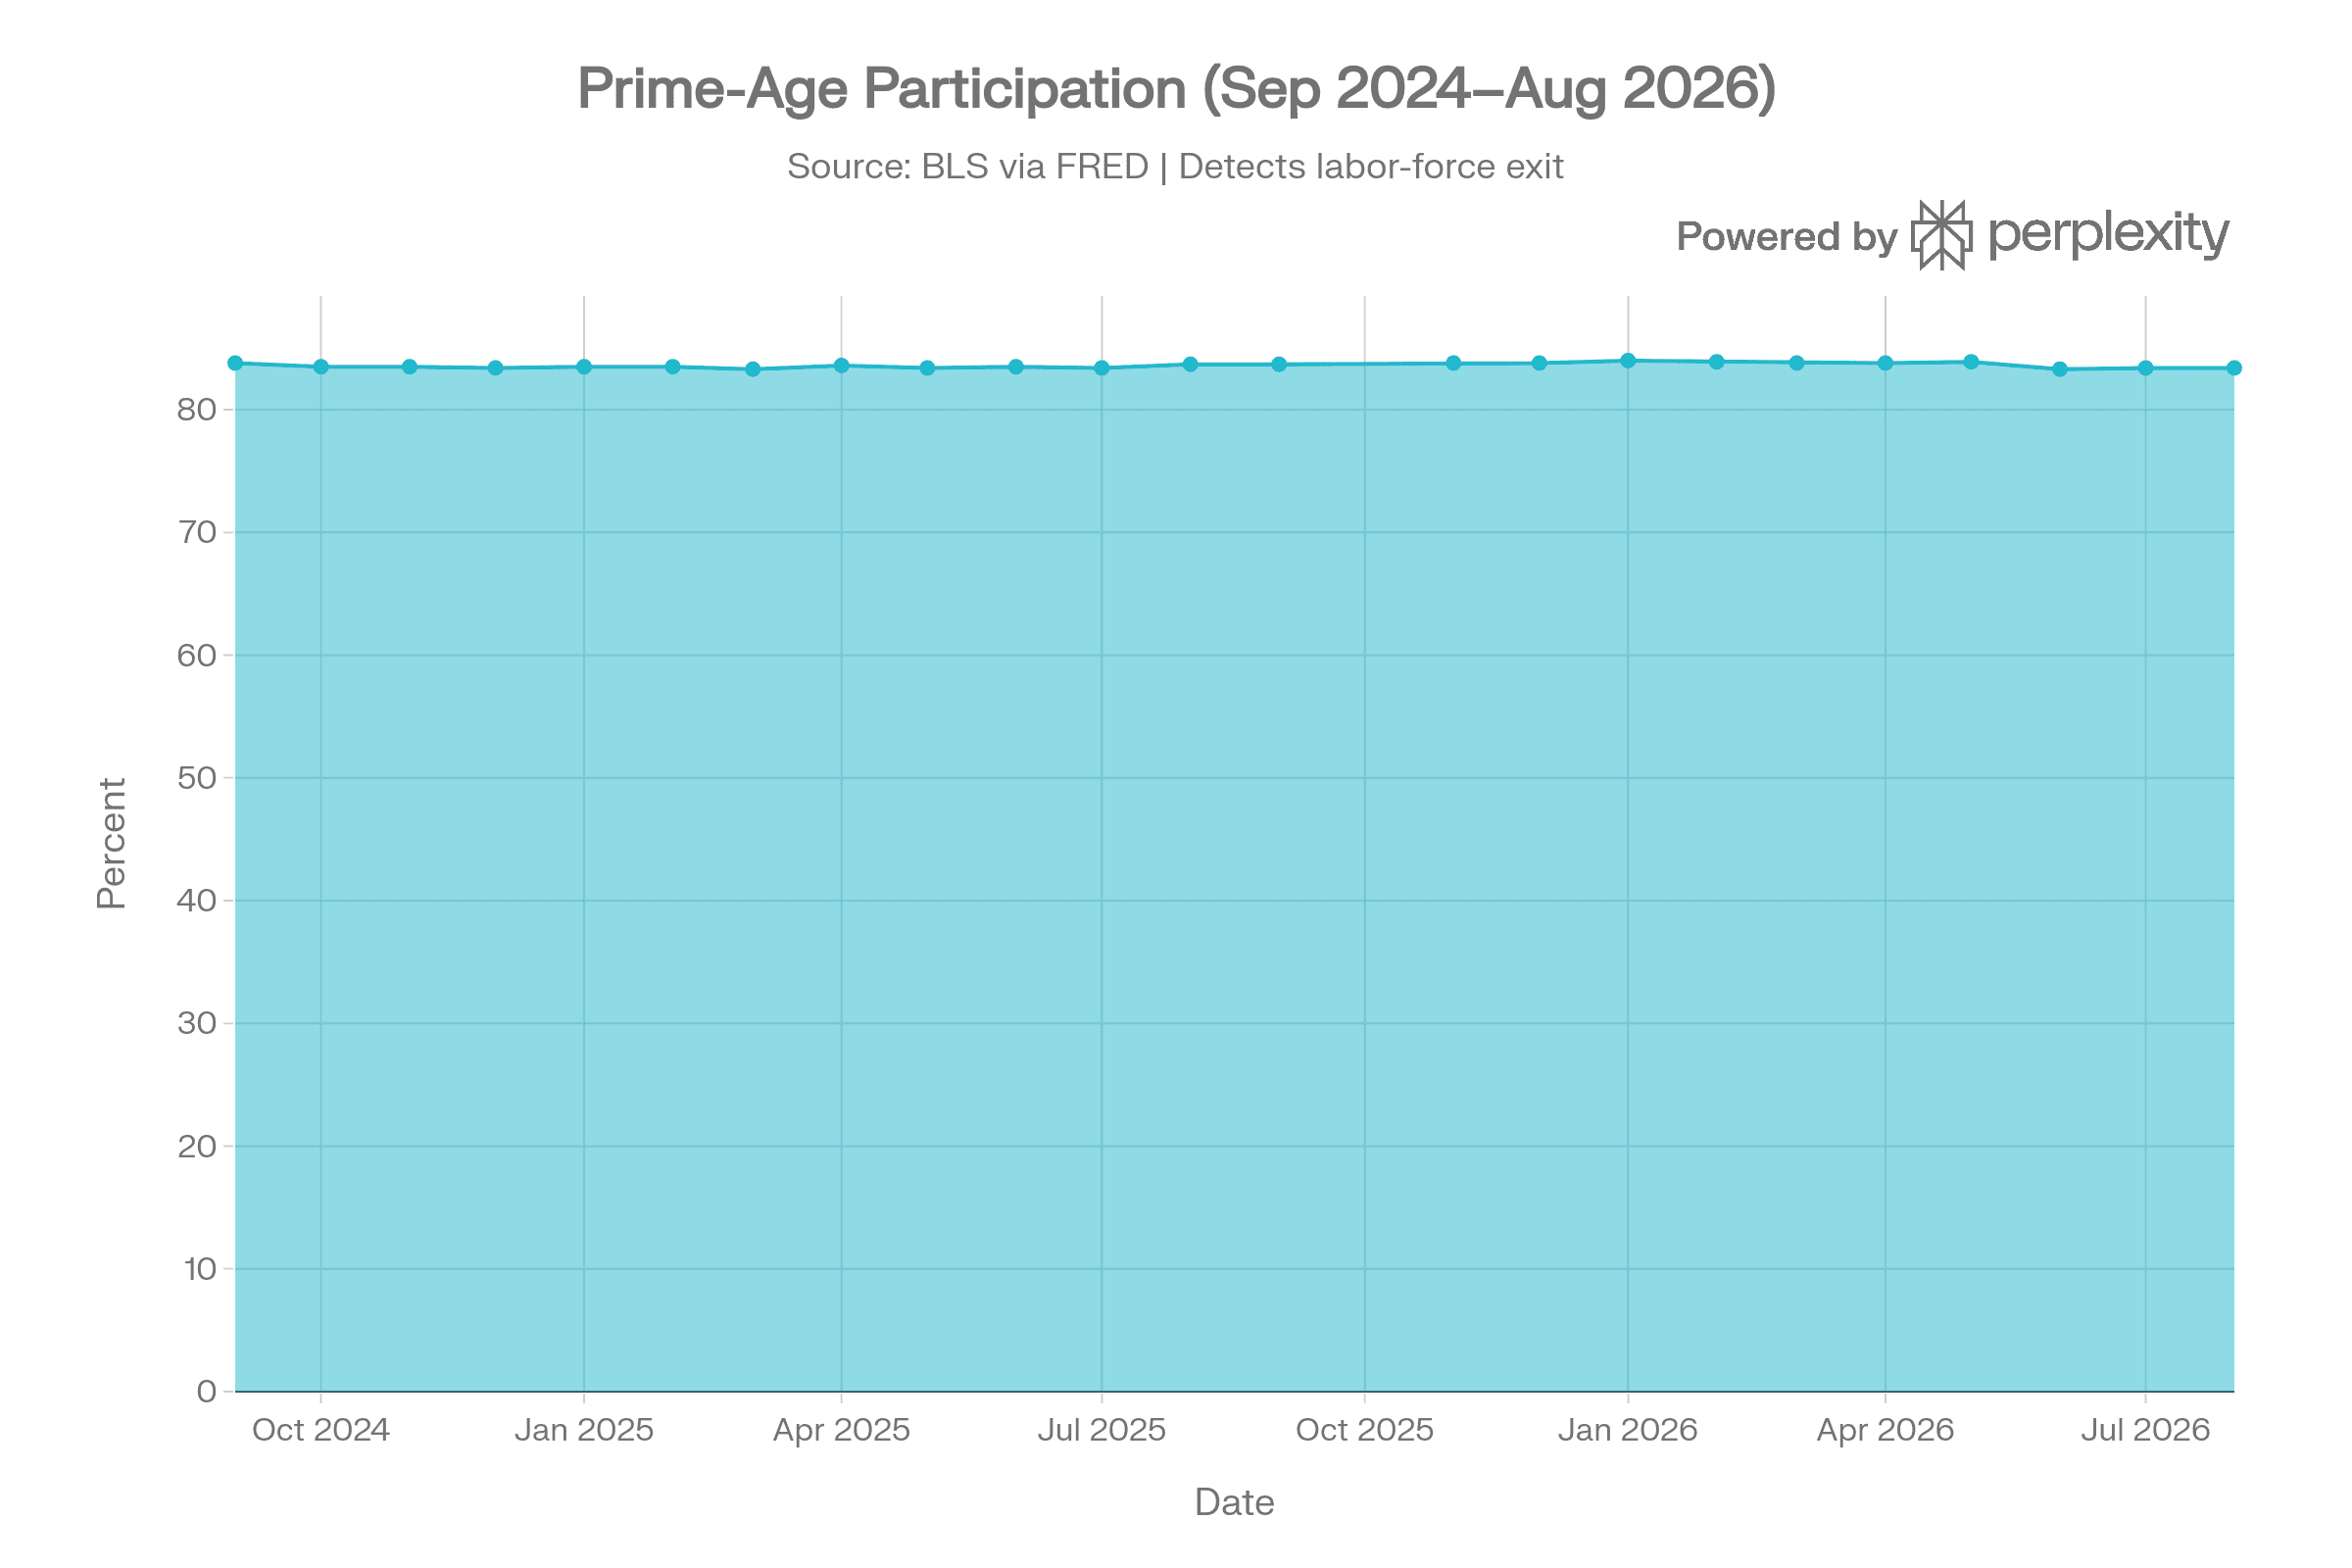
Labor-force participation among people ages 25–54 decreased from 83.8% in September 2024 to 83.4% in August 2026.
Why it matters: People who stop looking for work are generally not counted as unemployed. A sustained decline in prime-age participation can therefore expose discouraged-worker exits, caregiving burdens, poor health, inaccessible jobs, or inadequate wages. This small decline is not independently determinative, but it becomes more significant if it occurs alongside rising long-term unemployment and weak hiring.
Household and Community Indicators
SNAP Participation
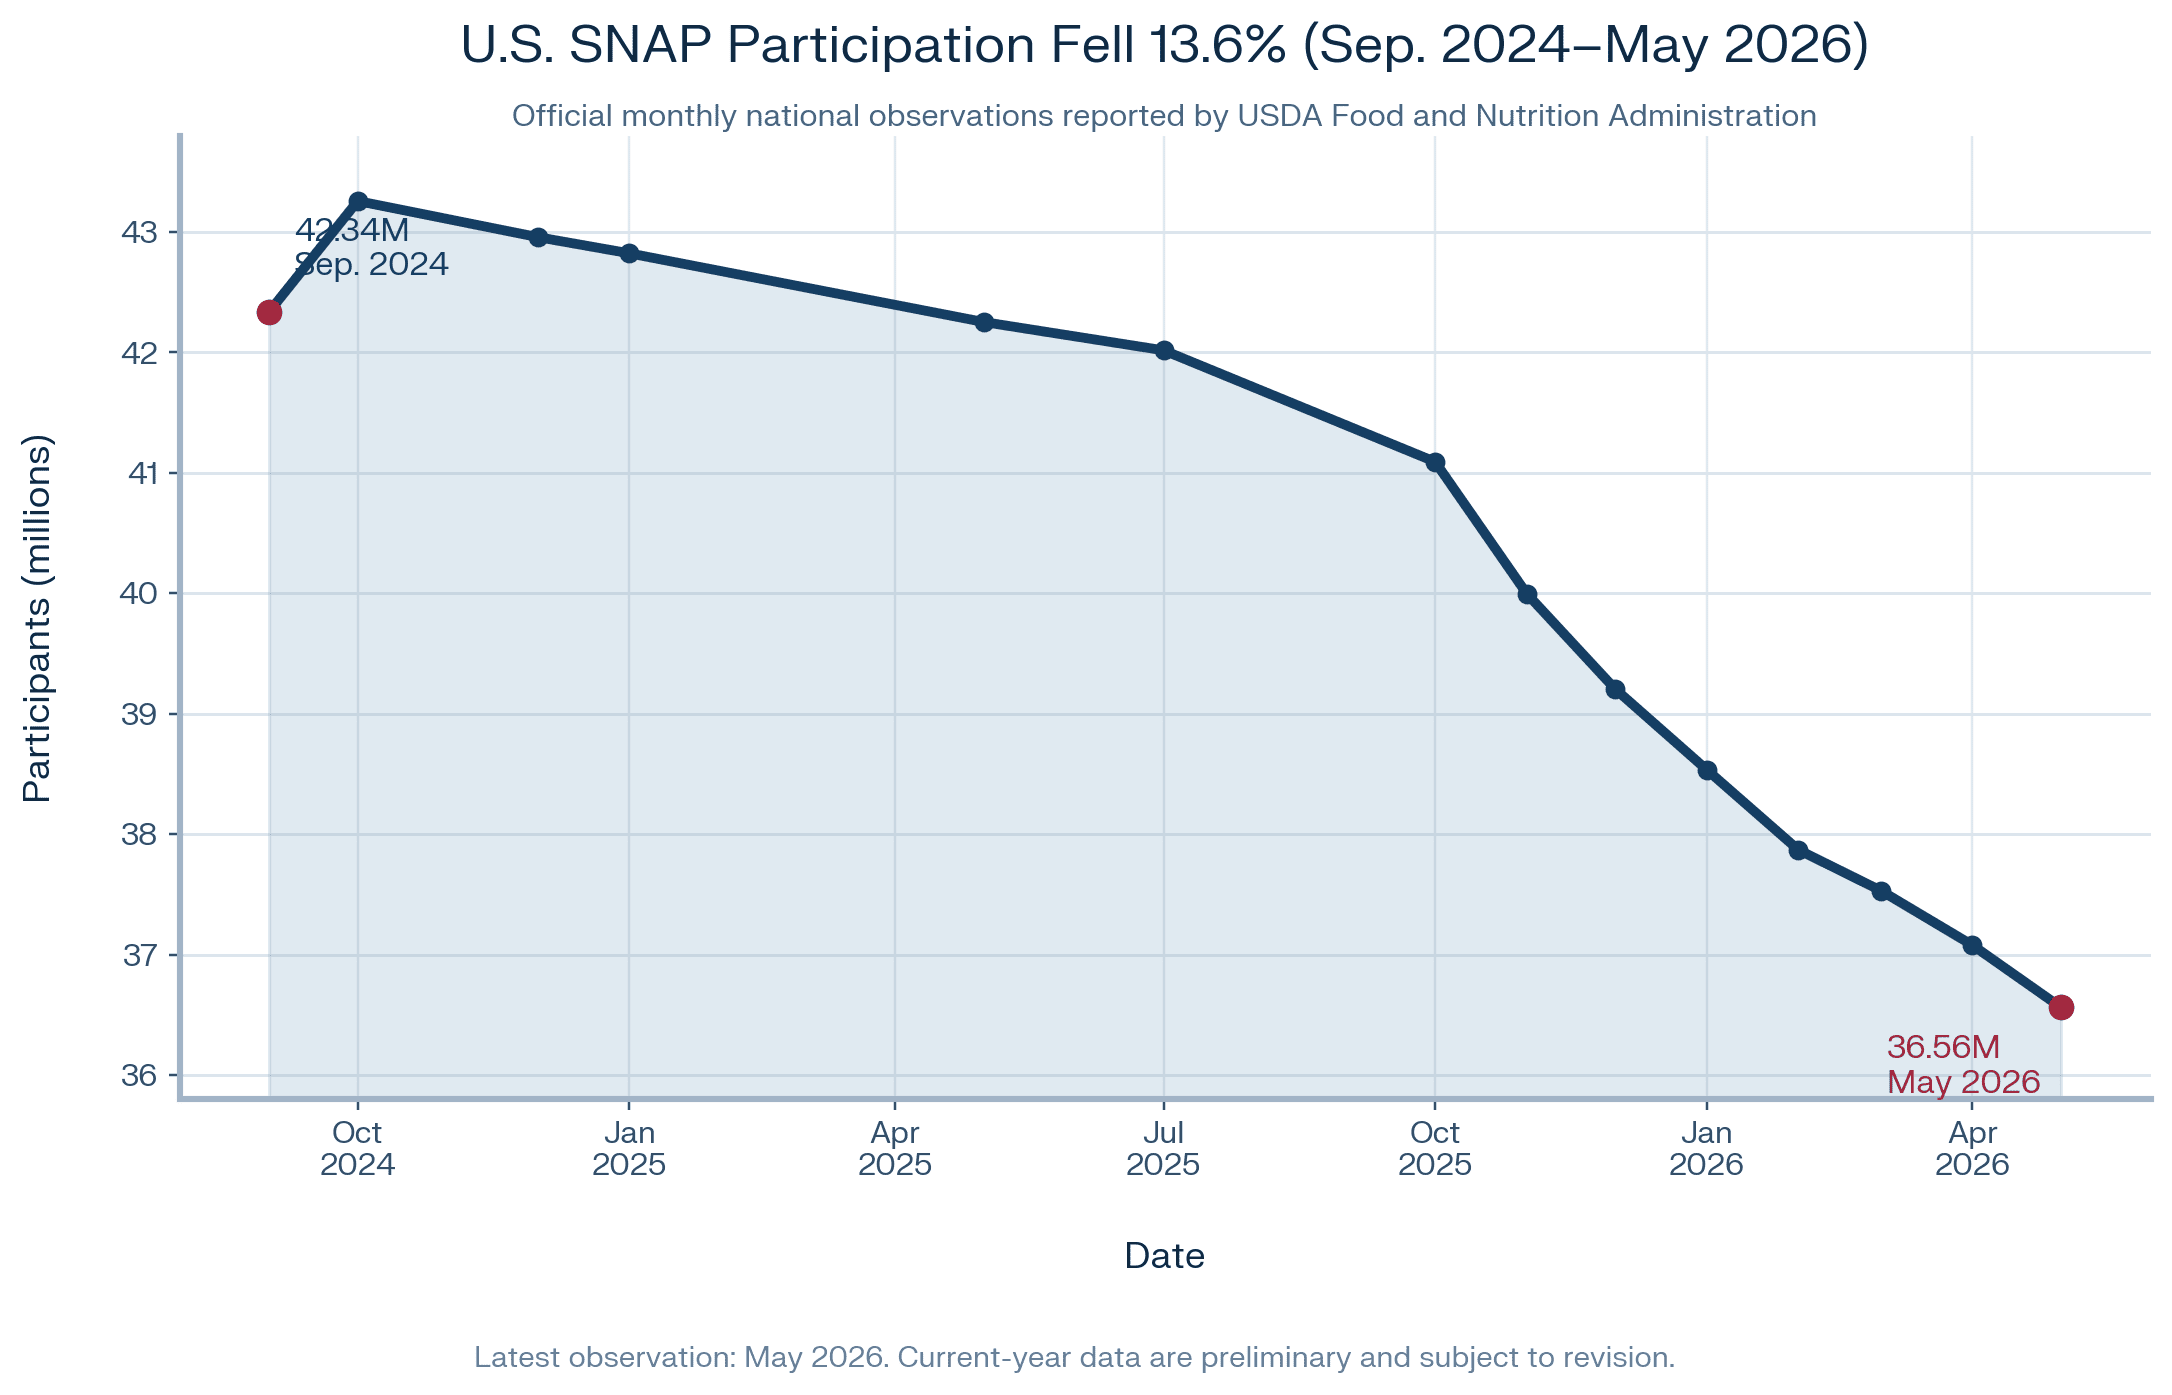
Monthly national SNAP participation fell from approximately 42.34 million people in September 2024 to 36.56 million in May 2026, a decline of 13.6%.
Why it matters: Food-assistance participation is a useful signal of household need and administrative access, but it must not be read as a direct measure of food insecurity. Enrollment can fall because household circumstances improve, but also because of eligibility changes, work requirements, administrative barriers, recertification failures, or reduced access. The appropriate warning signal is a divergence in which food-assistance participation falls while food-bank demand, missed meals, rent arrears, or other hardship indicators rise.
Mortgage Delinquency
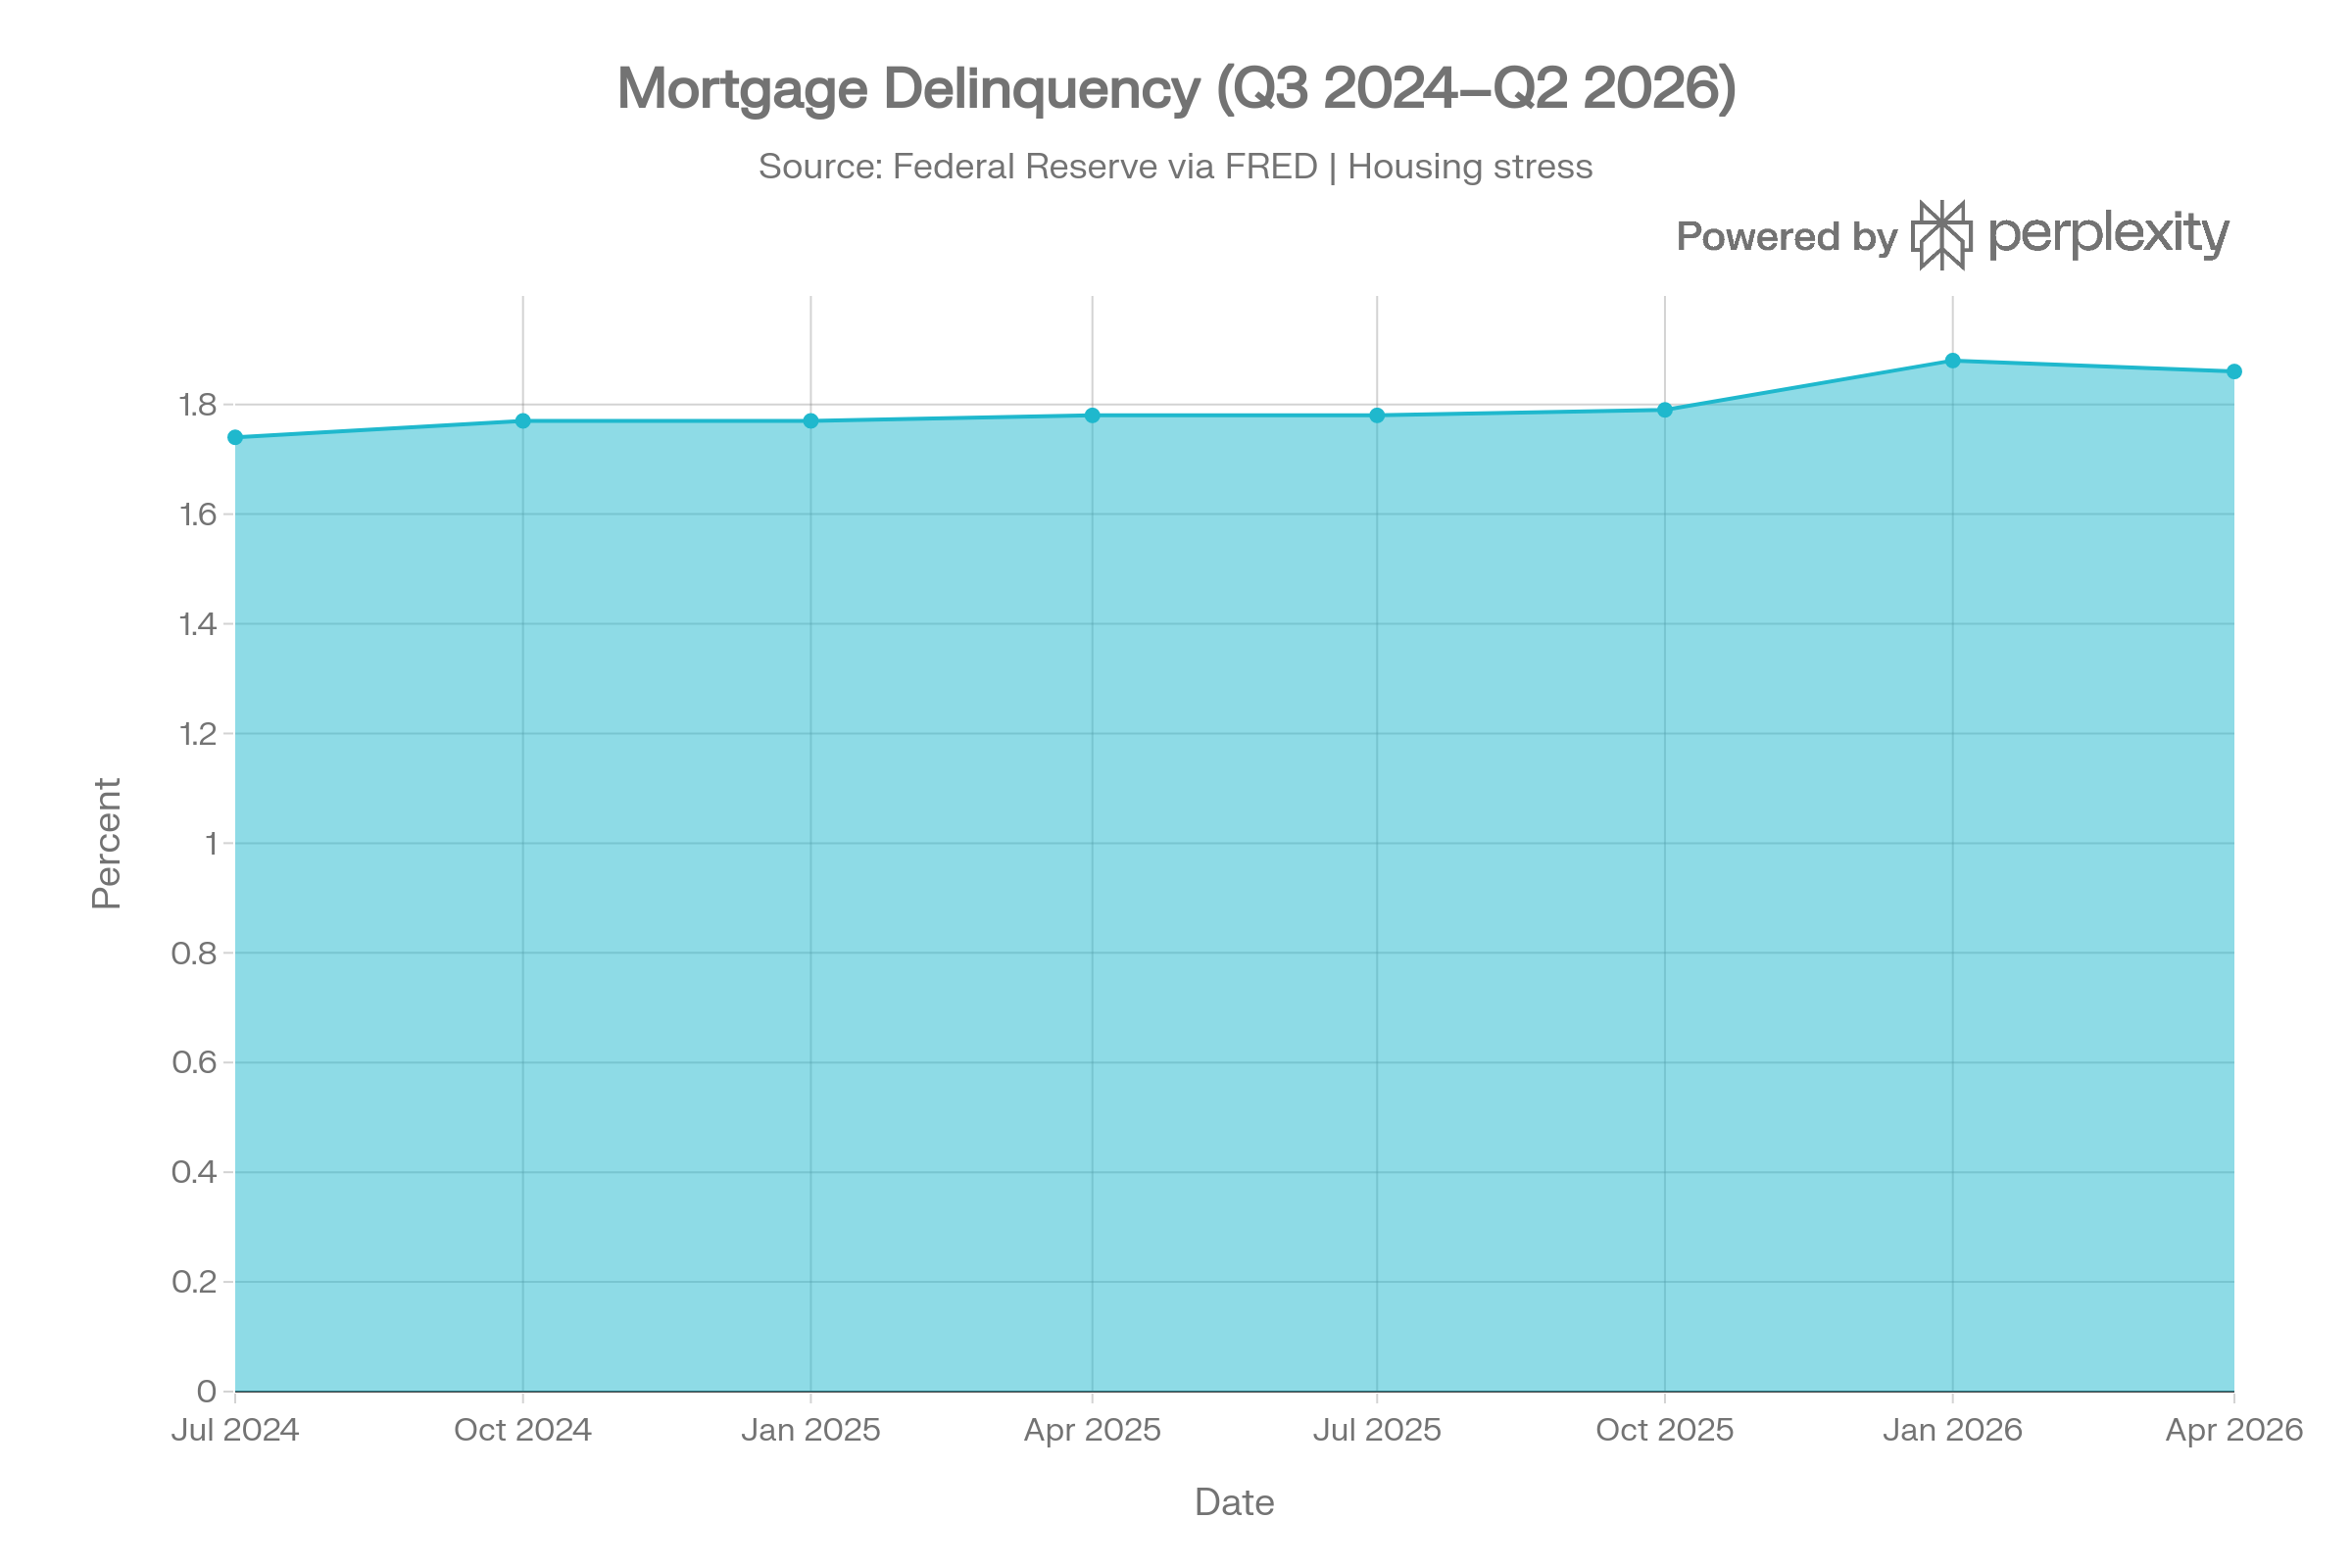
The commercial-bank delinquency rate for single-family residential mortgages rose from 1.74% in the third quarter of 2024 to 1.86% in the second quarter of 2026.
Why it matters: Mortgage delinquency is a direct household-stability indicator. When income shocks persist, households frequently exhaust savings and revolving credit before they miss secured payments. A sustained rise, particularly in communities with deteriorating hiring and long-term unemployment, would warrant housing-stabilization planning.
Credit-Card Delinquency
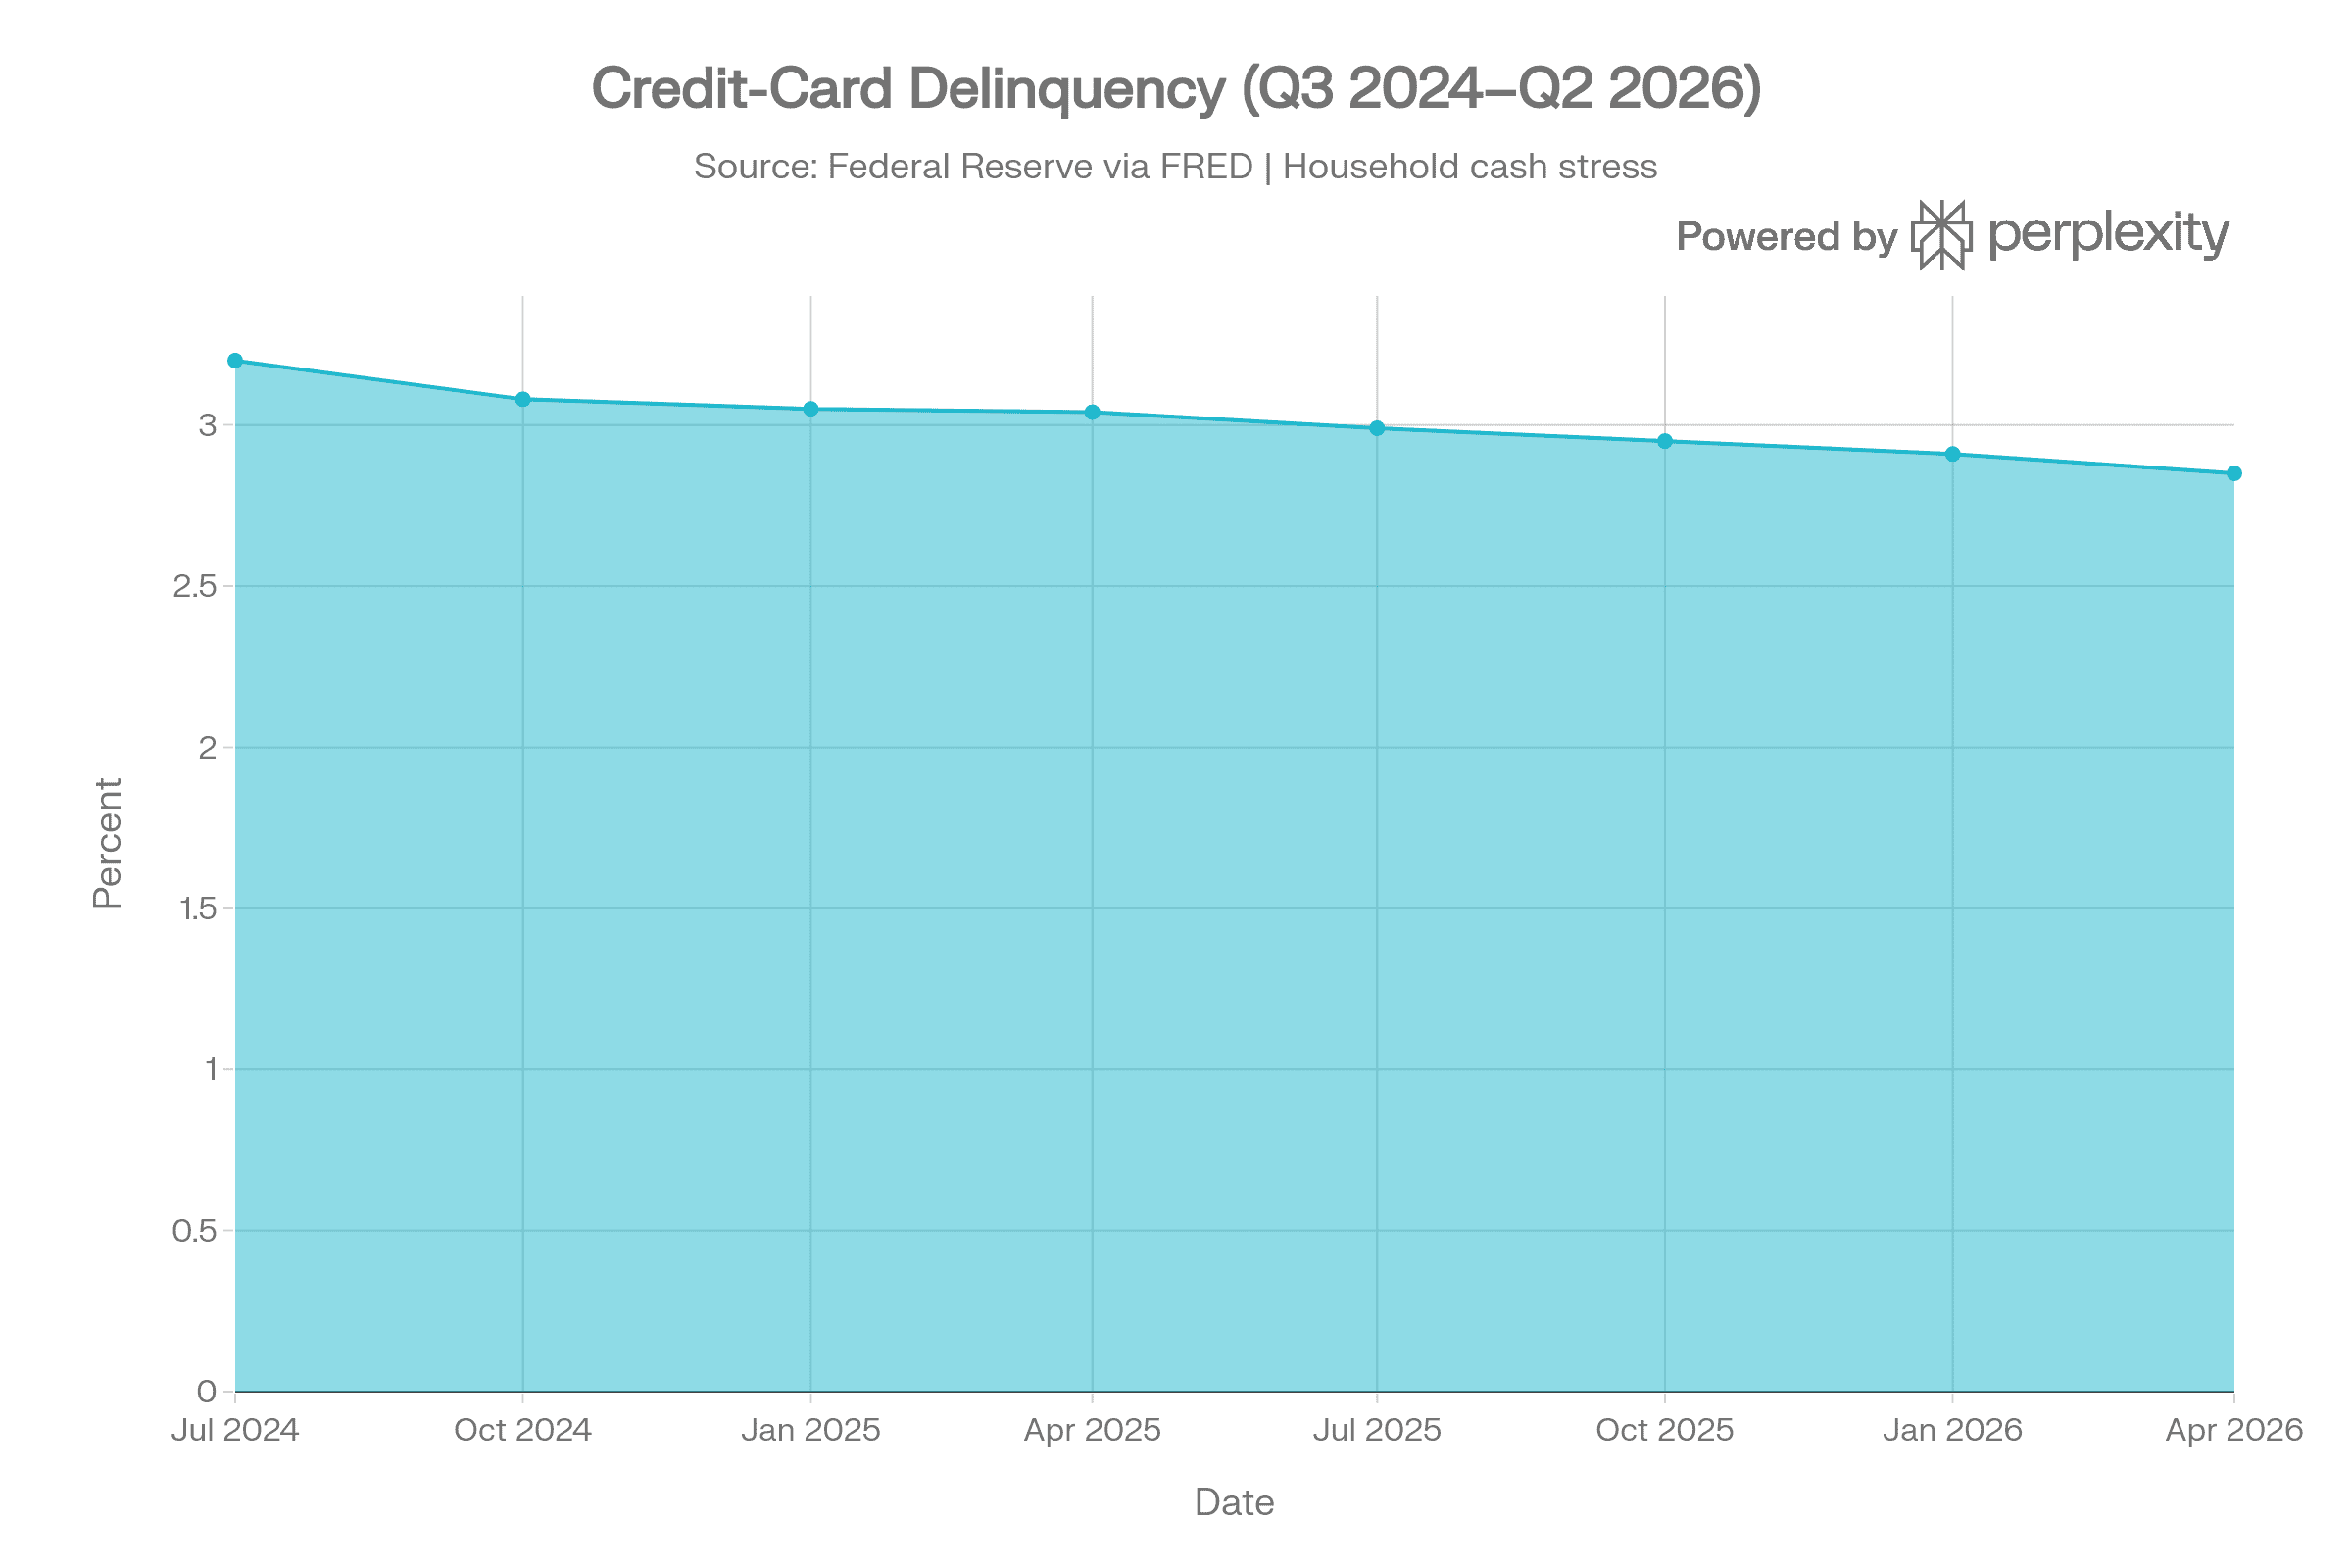
Commercial-bank credit-card delinquency declined from 3.20% in the third quarter of 2024 to 2.85% in the second quarter of 2026.
Why it matters: Revolving consumer debt often absorbs early income or expense shocks. The decline is a positive national indicator, but it should be monitored by geography and household segment because aggregate improvement can coexist with localized financial distress.
988 Crisis-Line Contacts
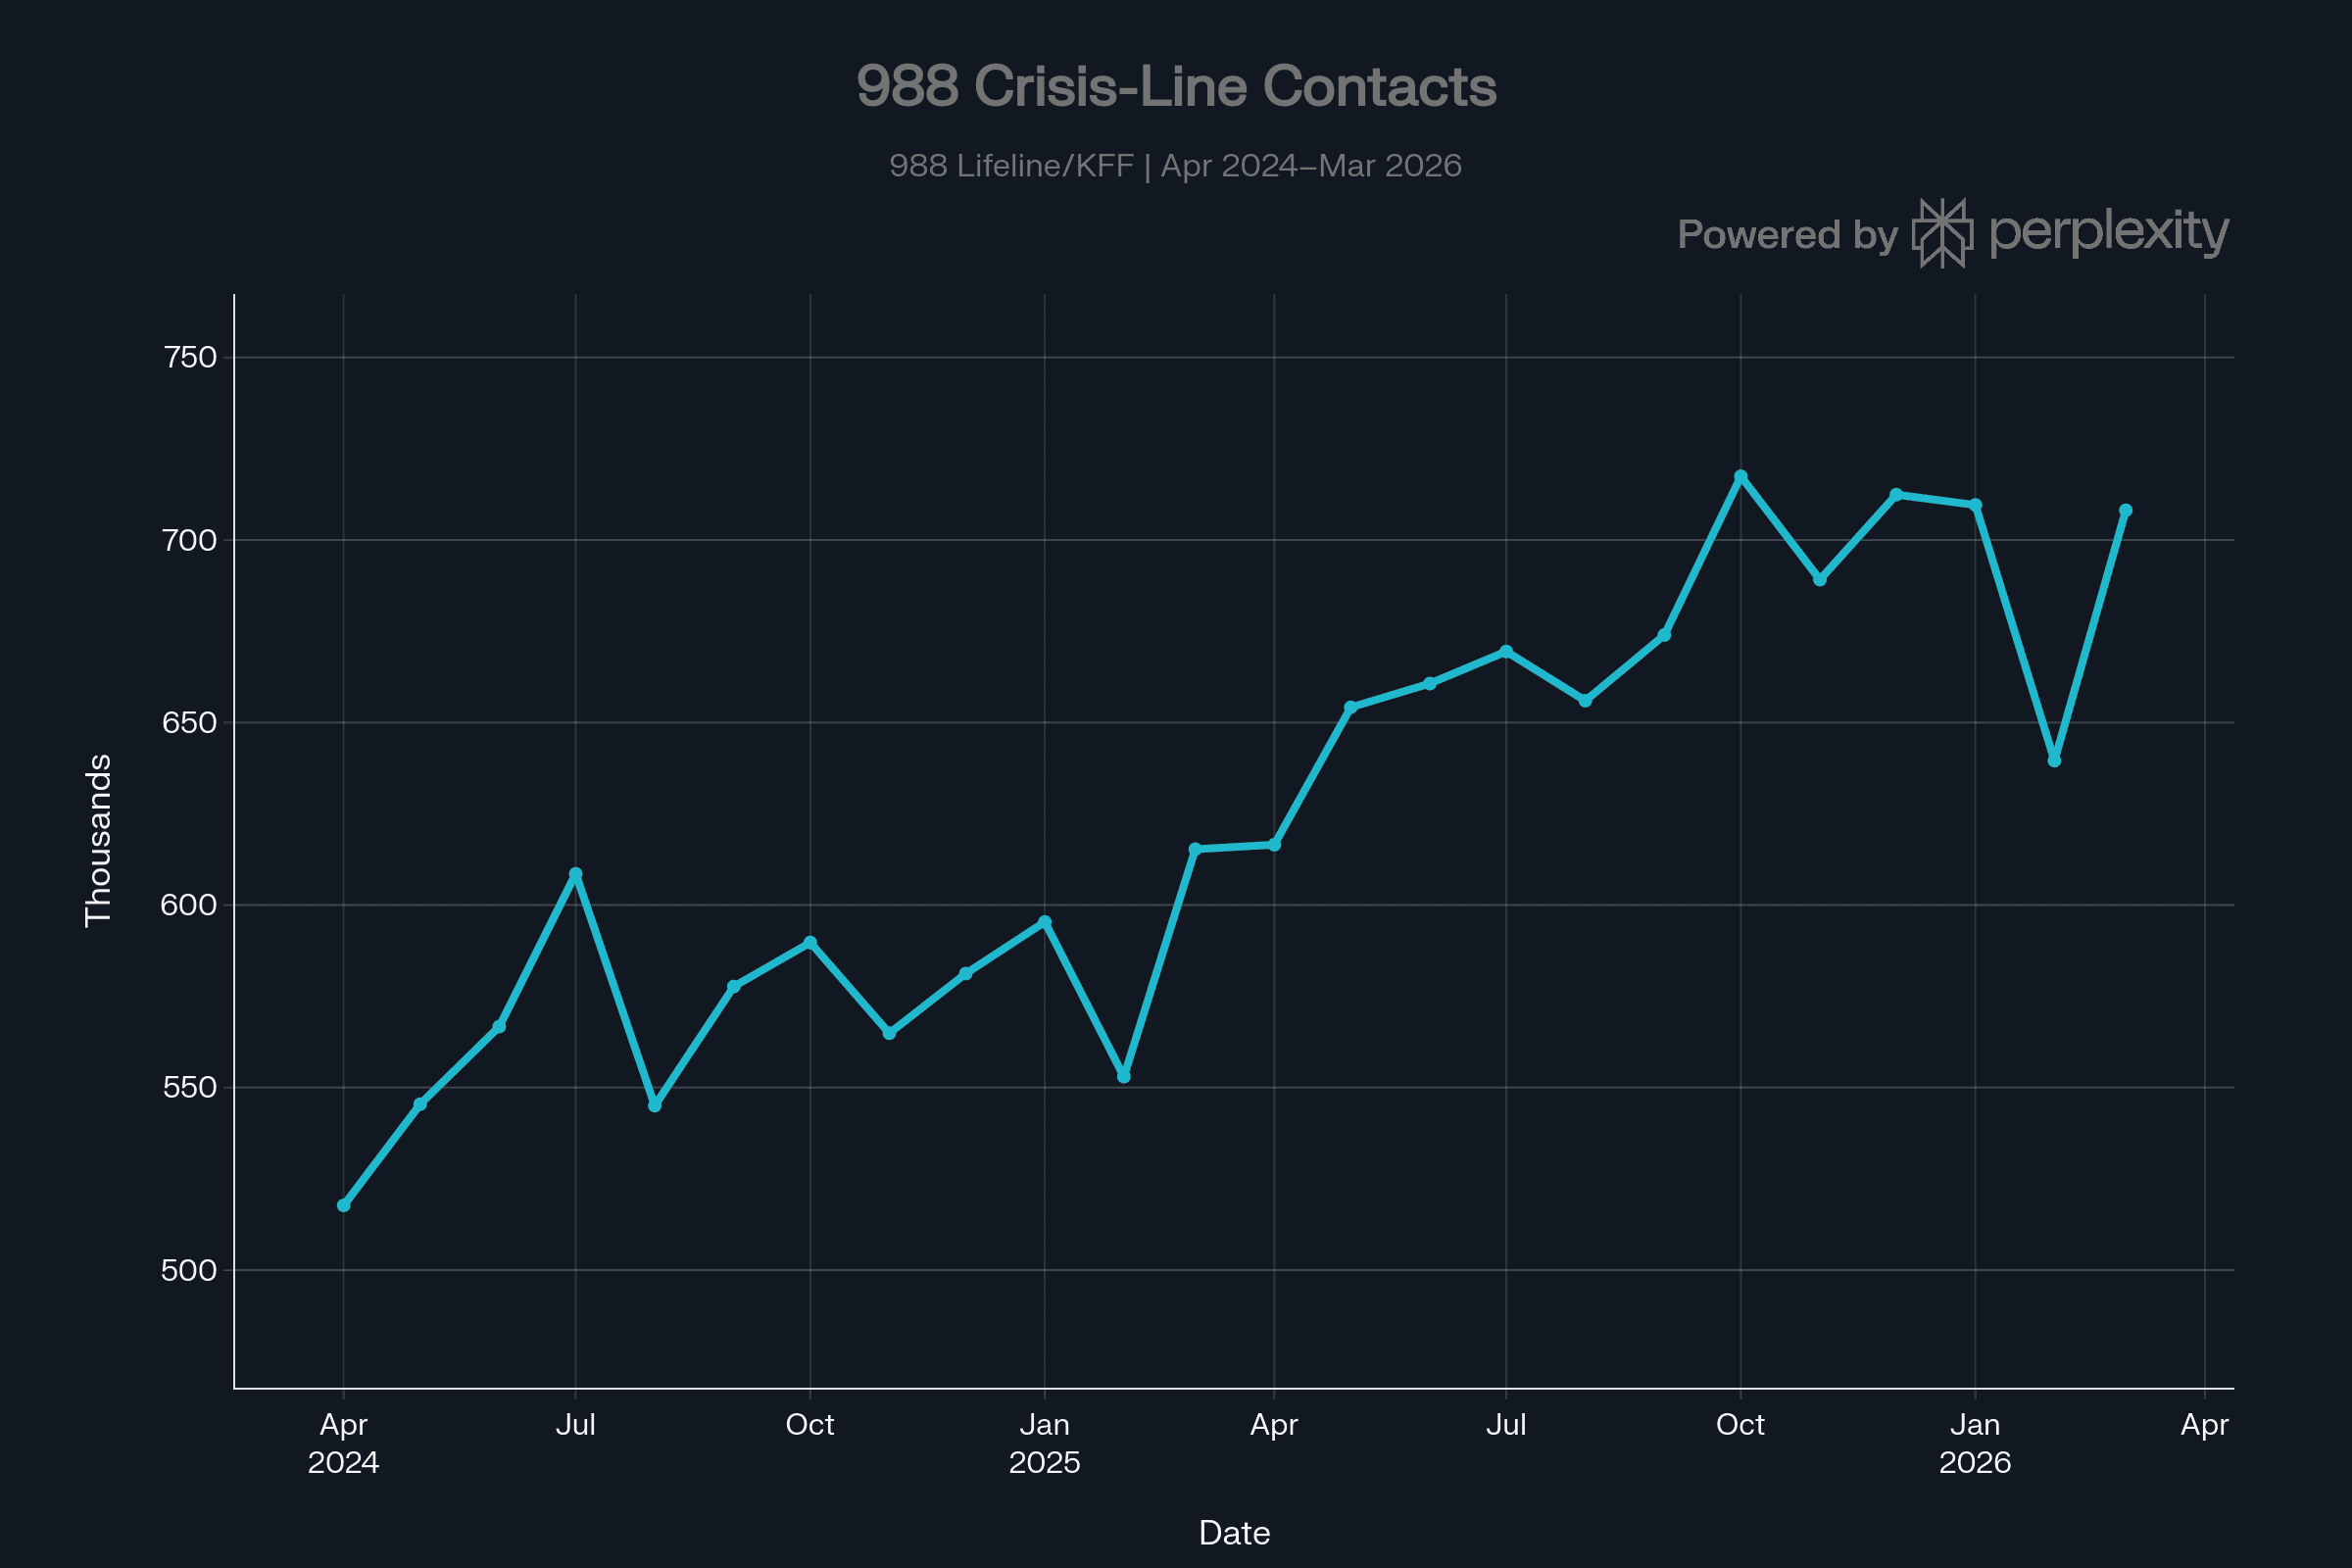
Monthly 988 calls, texts, and chats rose from approximately 518,000 in April 2024 to 708,000 in March 2026, an increase of nearly 37%.
Why it matters: Rising crisis-line demand is an early signal of mental-health service pressure and distress. The measure is not a labor-market causal test: increased awareness, improved access, new modalities, and changing public willingness to seek help all affect the volume. However, rapid growth in 988 contacts within a labor-displacement hotspot would justify coordination among workforce, healthcare, housing, and community-support agencies.
State and Local Tax Receipts
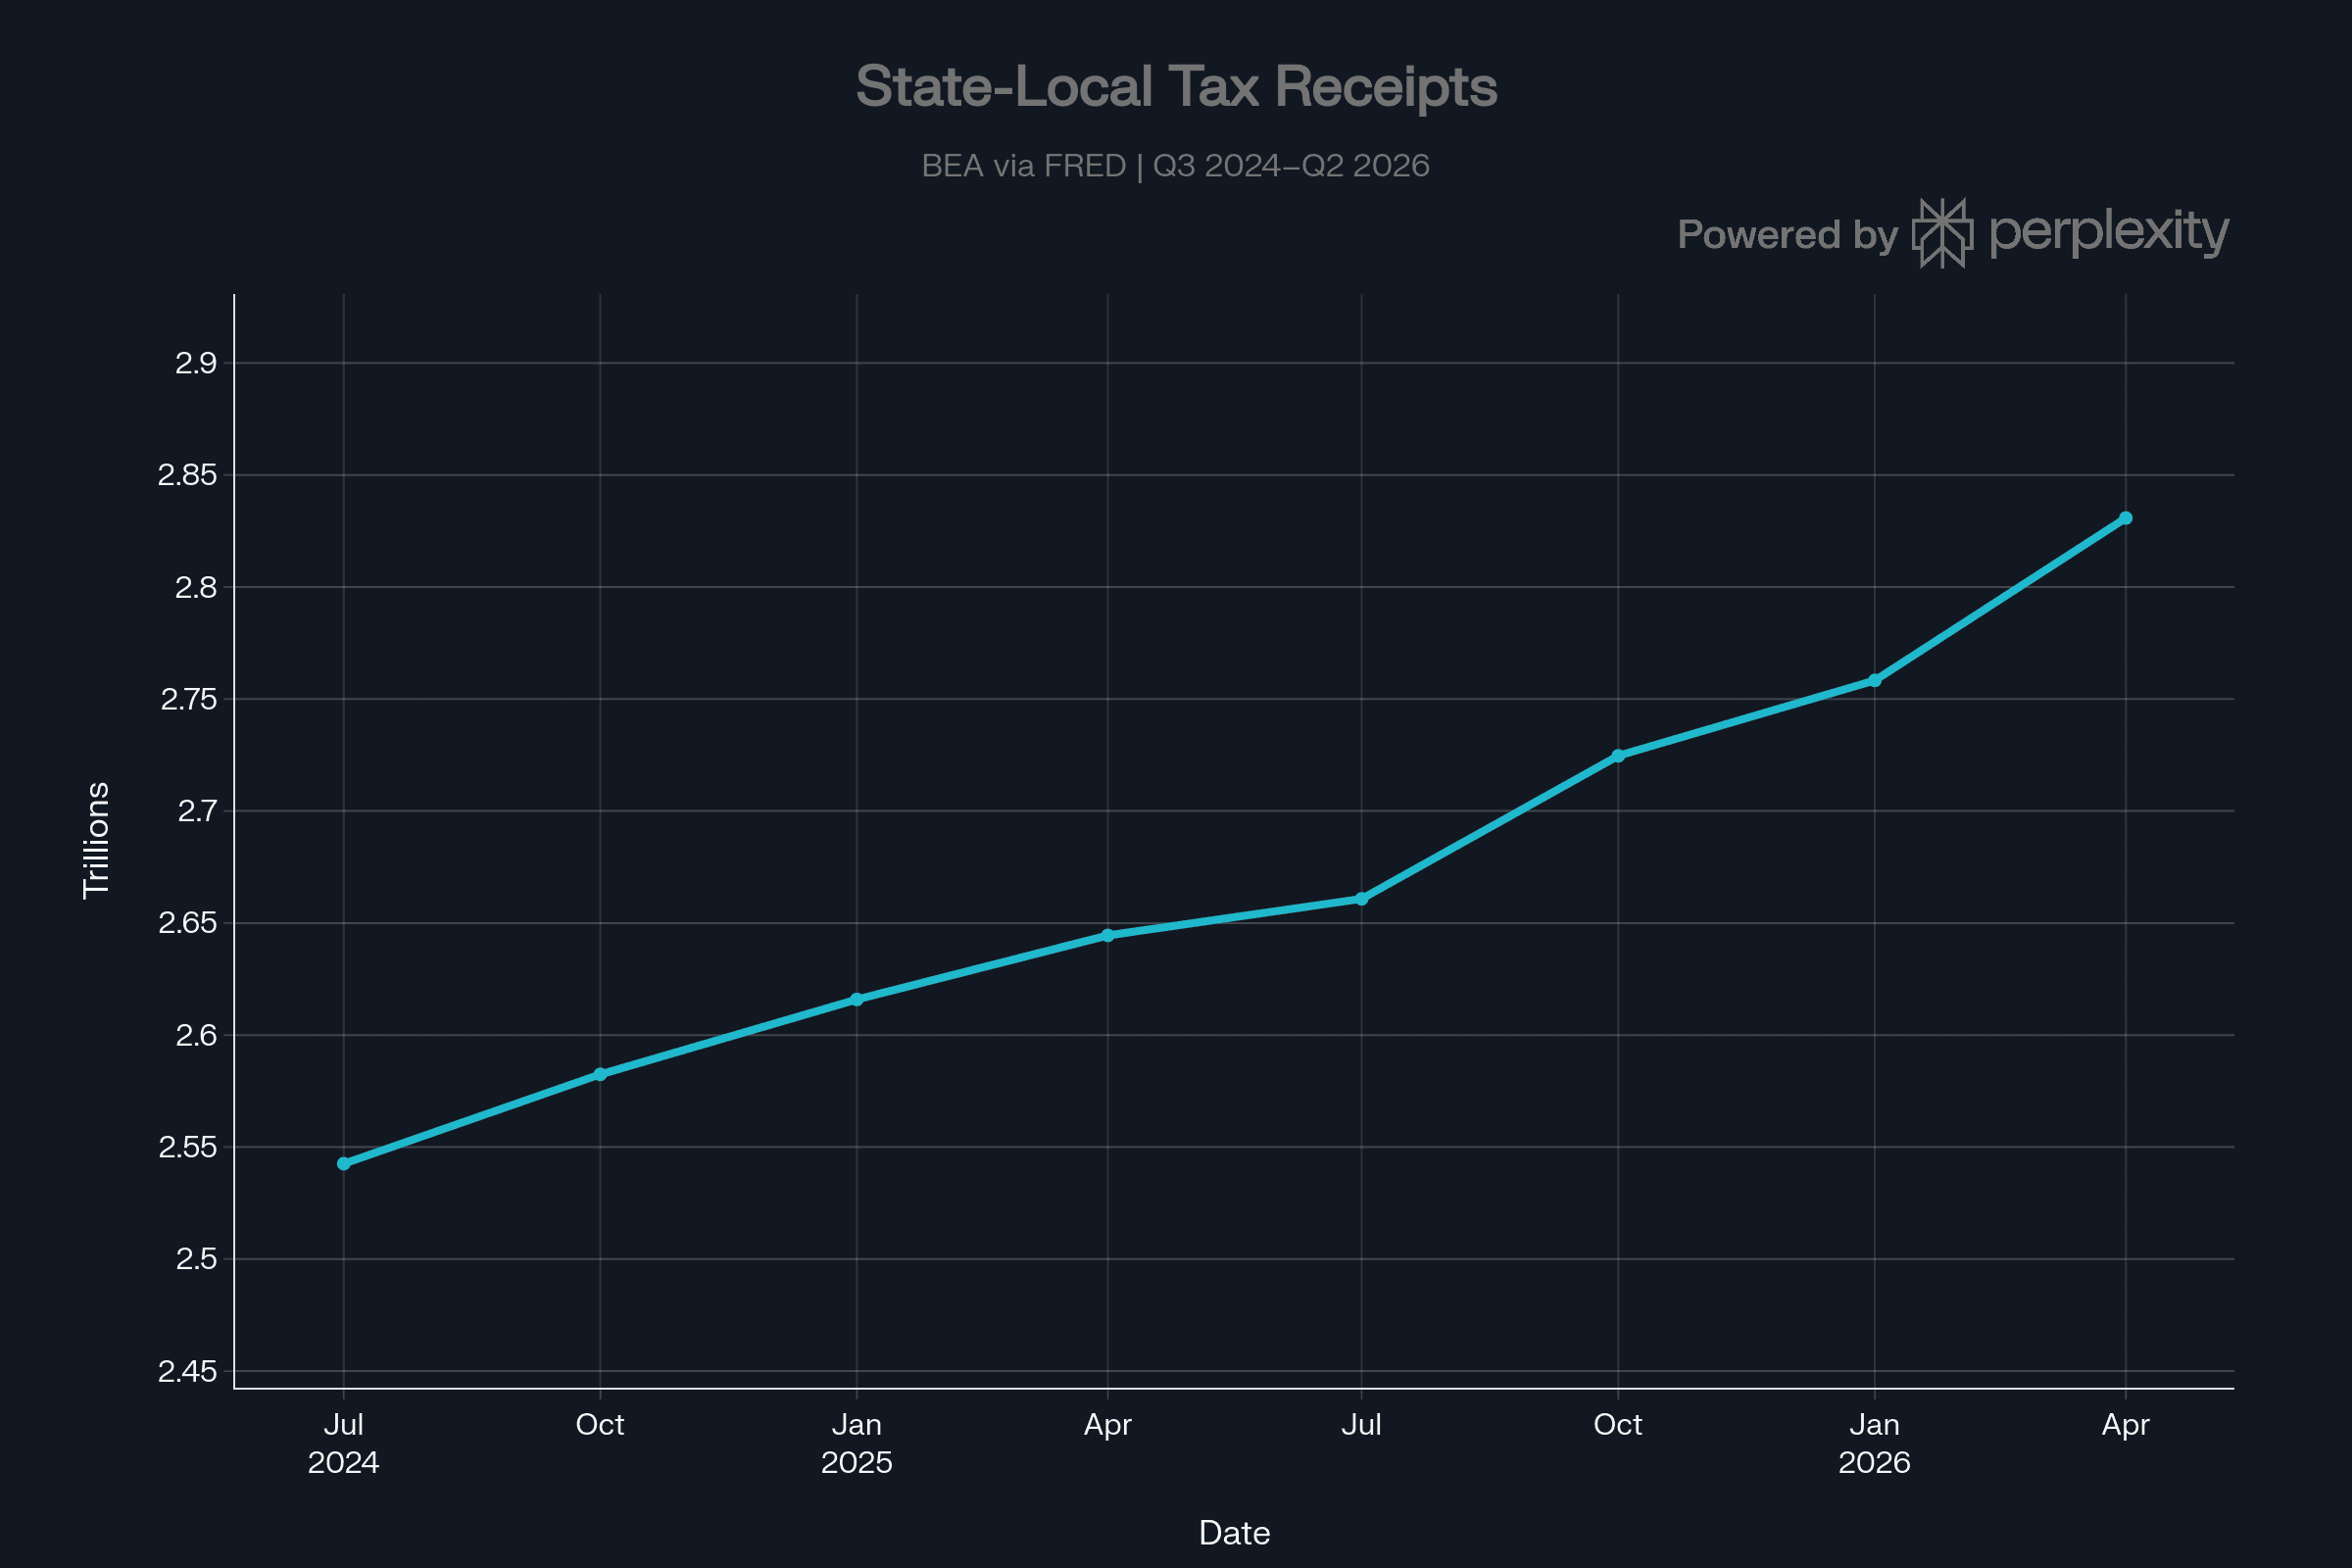
State and local current tax receipts rose from an annualized $2.54 trillion in the third quarter of 2024 to $2.83 trillion in the second quarter of 2026.
Why it matters: Local governments must respond to the downstream effects of displacement through housing services, schools, public safety, public health, libraries, workforce programs, and infrastructure. National growth in receipts is a positive capacity signal, but it can conceal serious local fiscal pressure. County- and city-level monitoring is essential before any continuity determination.
Critical-Workforce Indicator
Construction Job Openings
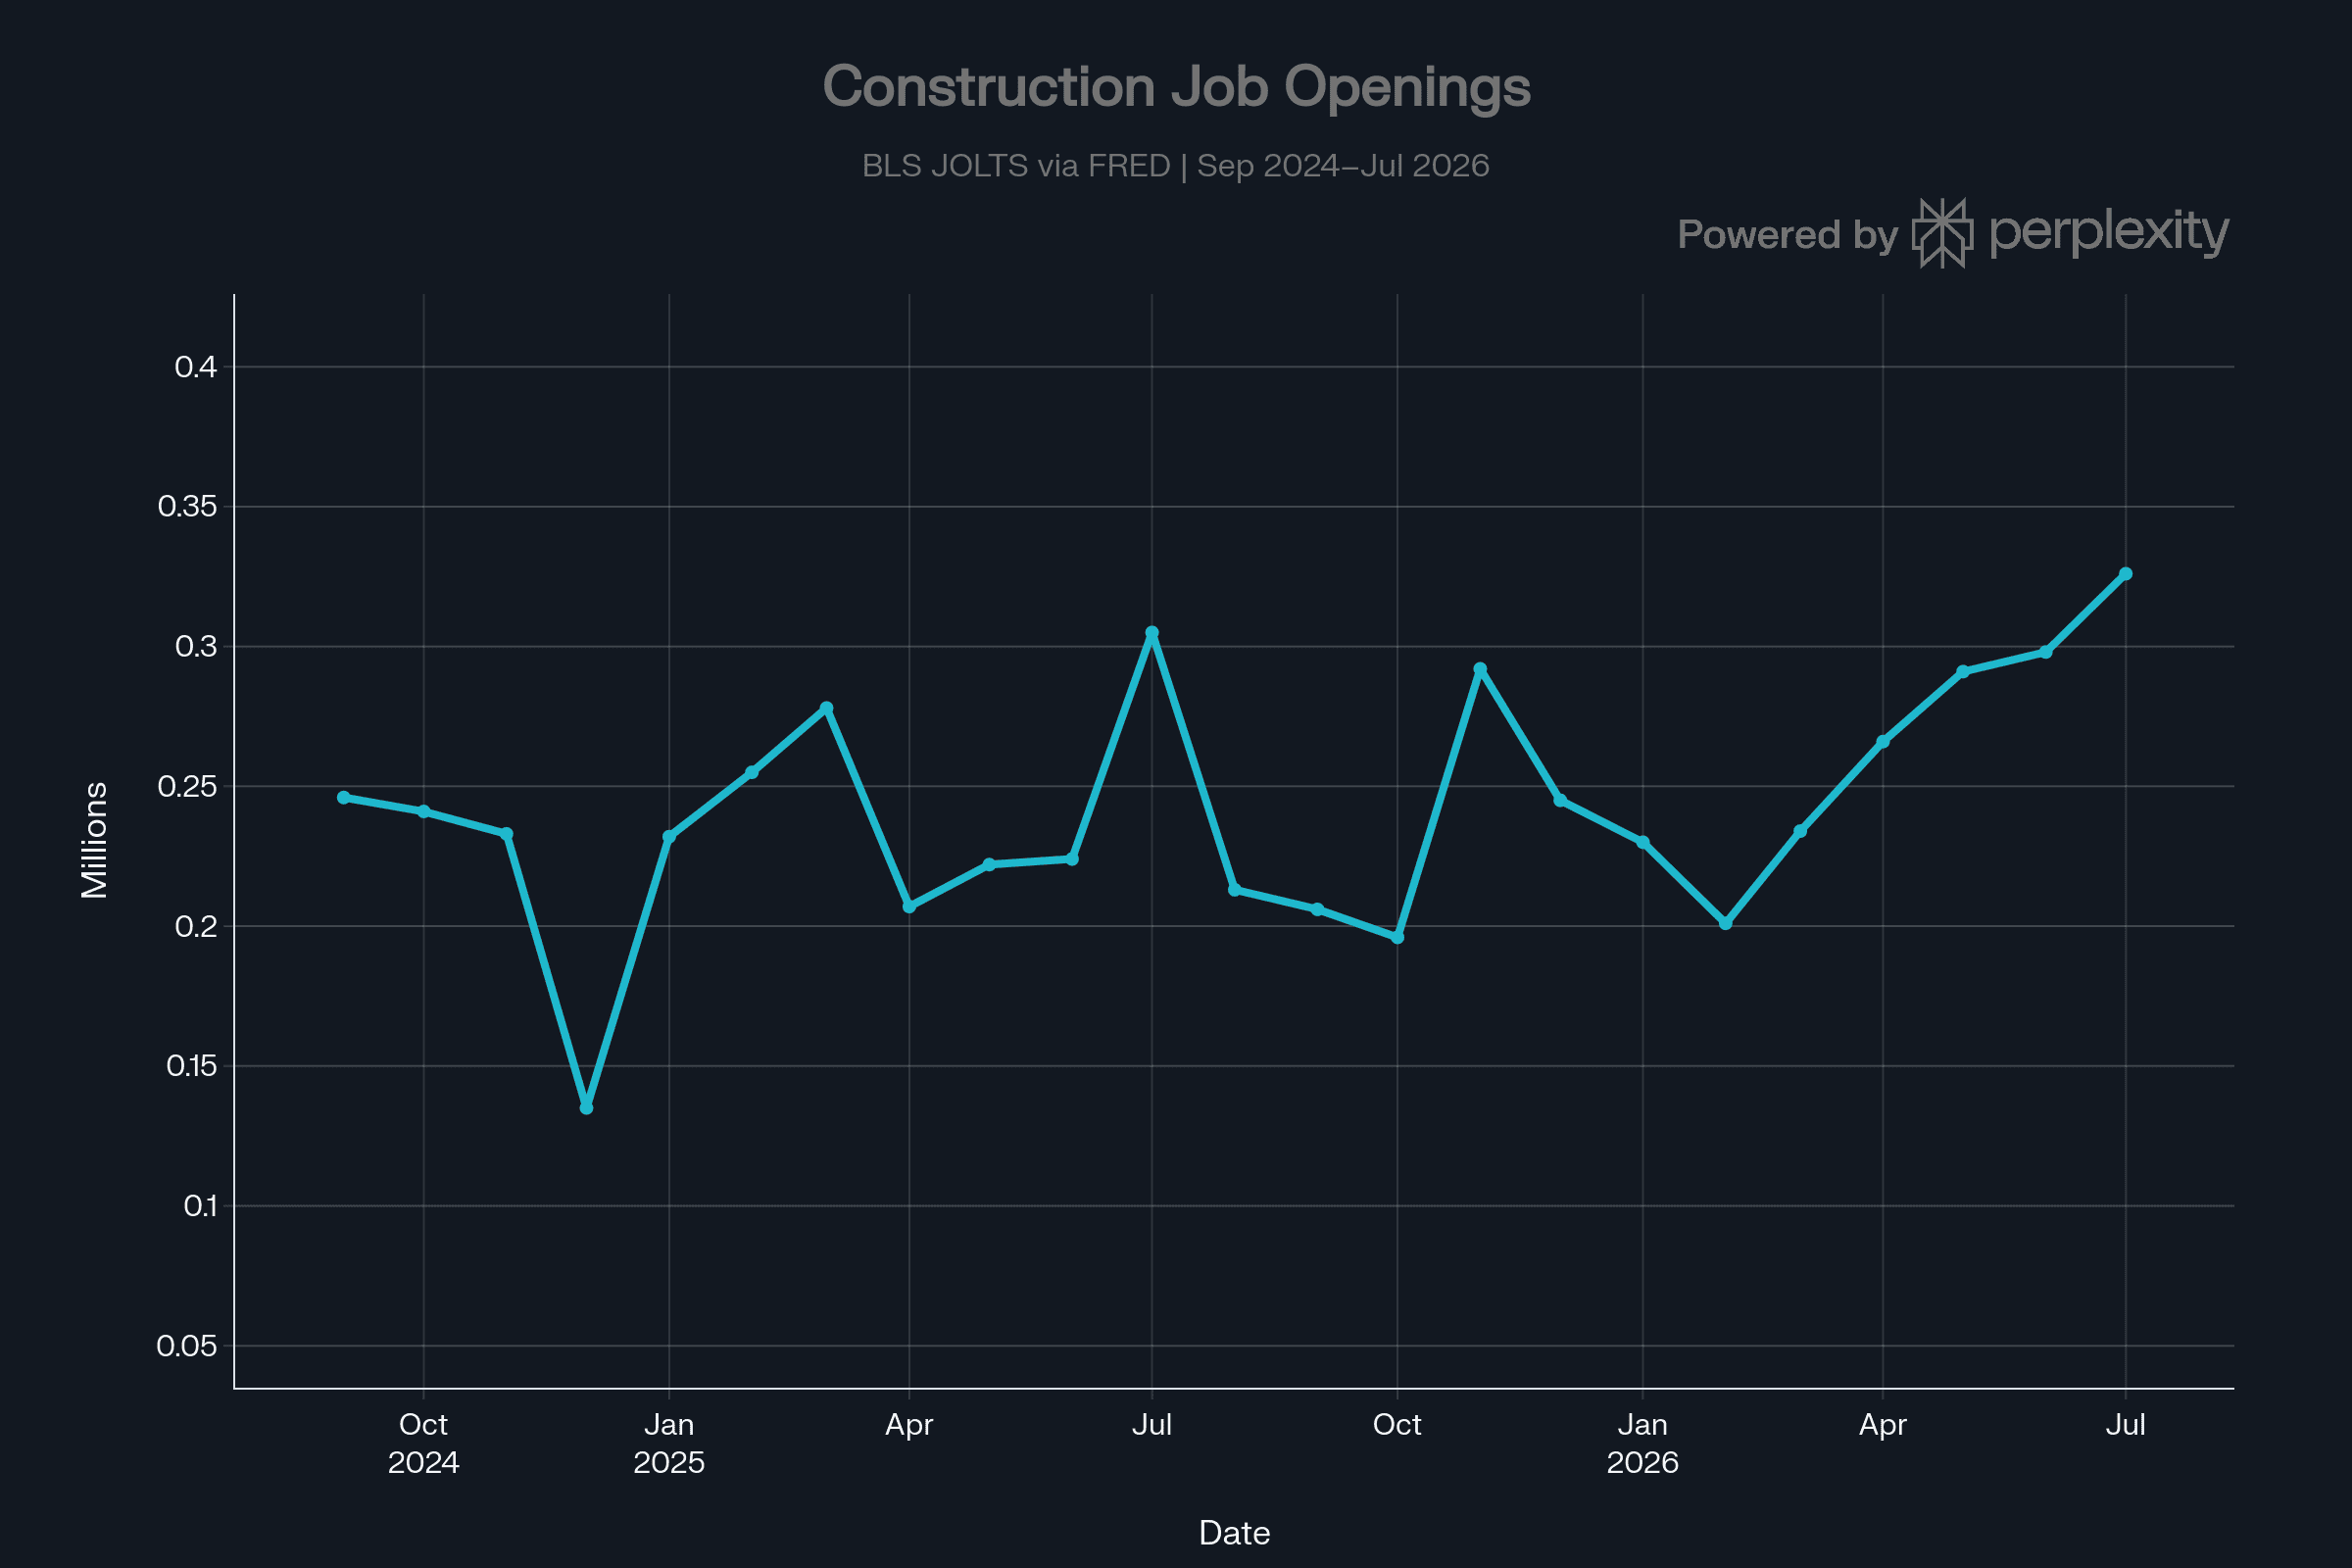
Construction job openings increased from about 246,000 in September 2024 to 326,000 in July 2026.
Why it matters: The AI economy can create a paradox: professional and administrative work may face task substitution while construction, electrical, HVAC, grid, data-center, maintenance, and related skilled trades face shortages. Labor policy must therefore avoid a one-dimensional “jobs lost” framework and instead preserve entry paths into critical trades, maintain safety-critical human redundancy, and connect transition programs to verified local demand.
Integrated Findings
The charts do not establish that AI is the primary cause of current labor-market changes. They do establish that the federal government should treat employment disruption as a multi-domain continuity issue rather than relying on the unemployment rate alone.
The highest-priority indicators for quarterly escalation review are:
- Long-term unemployment, because it rose nearly 20% over the available period.
- Actual worker hires, because they fell even as job openings increased.
- Young-worker employment and entry-level hiring, because career-ladder damage may be hidden in aggregate data.
- Prime-age labor-force participation, because labor-force exits may not appear in unemployment statistics.
- Mortgage delinquency, rent arrears, utility shutoffs, and eviction filings, because household instability can accelerate after income loss.
- 988 demand and local behavioral-health capacity, because economic distress and mental-health strain can compound.
- Local tax receipts, reserve drawdowns, service backlogs, and critical-workforce vacancies, because civil continuity depends on local delivery capacity.
Recommended Actions
- Establish a National AI Labor Displacement and Civil Continuity Working Group for a 24-month term, with Labor, Commerce, Treasury, Education, Health and Human Services, Housing and Urban Development, Agriculture, Energy, Transportation, and state-local partners.
- Publish a privacy-protective national dashboard monthly, supplemented by quarterly occupation, age, and regional analysis.
- Require early-warning review when adverse movement occurs across at least two labor indicators and one household or community indicator in the same region.
- Modernize unemployment-insurance administration and identity-recovery processes before an emergency expansion of benefits is needed.
- Expand short-time compensation and work sharing so employers can reduce hours with partial income replacement rather than concentrating losses in layoffs.
- Tie publicly supported AI deployment, tax incentives, procurement, and transition grants to transparent reporting on hiring, job redesign, worker training, junior-role preservation, and wage outcomes.
- Pre-authorize targeted housing, food, health-coverage, and mental-health support for regions that cross predefined escalation thresholds.
- Preserve civil liberties. No response may treat unemployed or underemployed citizens as a threat class, condition essential aid on political or religious status, impose compelled labor, use generalized surveillance, restrict movement, or create permanent personal risk classifications.
Methodology and Limitations
- All charts use real public data. The primary sources are the Bureau of Labor Statistics, the U.S. Department of Agriculture Food and Nutrition Service, the Federal Reserve, the Bureau of Economic Analysis, and 988 Lifeline data summarized by KFF.
- The data windows vary because releases have different reporting lags and frequencies. Monthly labor data generally extend through July or August 2026; weekly claims through late August 2026; quarterly finance and fiscal data through the second quarter of 2026; SNAP through May 2026; and 988 national contacts through March 2026.
- The charts identify conditions consistent with labor-market and civil-continuity risk. They do not independently prove causation by AI.
- Interpretation should account for macroeconomic conditions, interest rates, policy and eligibility changes, demographics, seasonal effects, local industry composition, and data revisions.
- This status report supports early warning and targeted investigation. It is not a legal finding, emergency declaration, or basis for limiting individual rights.